

Janis Abolins
DYNF strategy
BlackRock U.S. Equity Factor Rotation ETF (NYSEARCA:DYNF) is an actively managed ETF launched on 03/19/2019. It has 124 holdings, an expense ratio of 0.30% and a 30-day SEC yield of 0.67%. Distributions are paid quarterly.
As described in the prospectus by iShares, the fund “seeks to outperform, before Fund fees and expenses, the investment results of the large- and mid-capitalization U.S. equity markets“. For this purpose, it uses a proprietary factor rotation model based on equity style factors such as momentum, quality, value, size and minimum volatility. The model emphasizes the factors with the highest probability of near-term outperformance based on “information about the current economic cycle as well as the valuations and recent trends for each factor“. The portfolio turnover rate was 118% in the most recent fiscal year. This article will use as a benchmark the S&P 500 index, represented by SPDR S&P 500 ETF Trust (SPY).
Portfolio
Large and mega cap companies represent about 88% of the portfolio’s value. Information technology is the heaviest sector by far (36.4%), followed by financials (19.7%) and consumer discretionary (14.8%). Other sectors are below 9%. Compared to the benchmark, DYNF overweights the top three sectors listed above, and underweights mostly healthcare.
DYNF sector breakdown (Chart: author; data: iShares, SSGA)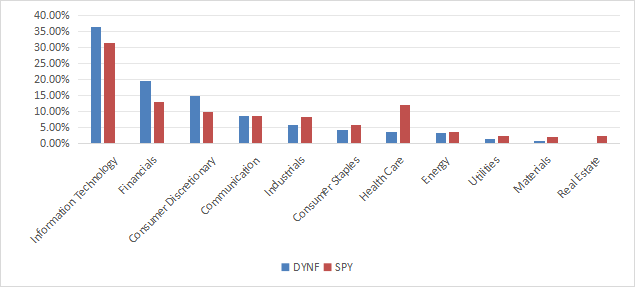
The portfolio is quite concentrated: the top 10 issuers, listed in the next table with fundamental ratios, represent 49.6% of asset value. The top 3 names weigh between 6.9% and 8%. Risks related to other individual stocks are low to moderate. For accuracy, the two share series of Alphabet Inc have been grouped in the table, although they are listed as distinct holdings by the fund.
|
Ticker |
Name |
Last |
EPS growth %TTM |
P/E TTM |
P/E fwd |
Yield |
|
NVIDIA Corp. |
7.99 |
788.51 |
66.14 |
41.76 |
0.04 |
|
|
Microsoft Corp. |
7.66 |
25.11 |
36.85 |
35.95 |
0.71 |
|
|
Apple, Inc. |
6.90 |
9.26 |
33.89 |
32.92 |
0.46 |
|
|
Alphabet, Inc. |
4.44 |
47.48 |
23.95 |
21.96 |
0.48 |
|
|
Amazon.com, Inc. |
4.26 |
763.59 |
51.26 |
39.80 |
0 |
|
|
Lennar Corp. |
4.04 |
0.37 |
12.01 |
12.35 |
1.13 |
|
|
JPMorgan Chase & Co. |
3.76 |
15.32 |
11.84 |
11.93 |
2.17 |
|
|
Berkshire Hathaway, Inc. |
3.75 |
876.68 |
12.92 |
23.10 |
0 |
|
|
Visa, Inc. |
3.51 |
18.89 |
28.19 |
26.17 |
0.80 |
|
|
Meta Platforms, Inc. |
3.29 |
115.95 |
26.75 |
22.95 |
0.43 |
Fundamentals
DYNF is cheaper than the benchmark regarding price-to-earnings, as reported in the next table. Other valuation ratios don’t show a significant gap. However, DYNF has superior growth rates.
|
DYNF |
SPY |
|
|
P/E TTM |
22.46 |
26.53 |
|
Price/Book |
4.48 |
4.63 |
|
Price/Sales |
3.06 |
3.02 |
|
Price/Cash Flow |
18.8 |
18.13 |
|
Earnings growth |
29.45% |
23.24% |
|
Sales growth % |
14.17% |
8.80% |
|
Cash flow growth % |
36.76% |
8.94% |
Data source: Fidelity
In my ETF reviews, risky stocks are companies with at least 2 red flags among bad Piotroski score, negative ROA, unsustainable payout ratio, bad or dubious Altman Z-score, excluding financials and real estate where these metrics are unreliable. With this assumption, risky stocks weight only 2.5% of asset value, which is an excellent point. Additionally, based on my calculation of aggregate quality metrics reported in the next table, portfolio quality is much better than the benchmark. The return on assets is particularly impressive.
|
DYNF |
SPY |
|
|
Altman Z-score |
11.13 |
3.81 |
|
Piotroski F-score |
6.60 |
5.98 |
|
ROA % TTM |
18.00 |
7.32 |
Performance
DYNF is marginally behind SPY in total return since inception. The difference in annualized return is insignificant.
DYNF vs SPY, since inception (Seeking Alpha)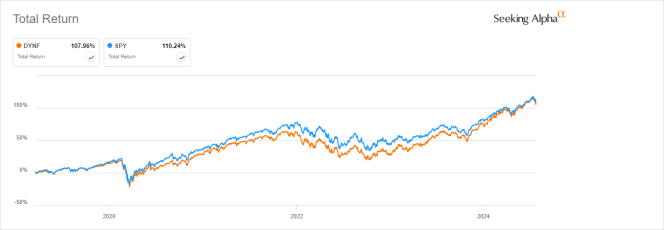
Nonetheless, DYNF is 6% ahead of the benchmark over the last 12 months:
DYNF vs SPY, 12-month return (Seeking Alpha)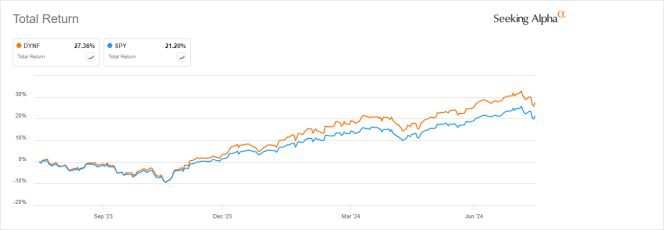
DYNF vs competitors
Fidelity and Morningstar classify the fund in the “Large Blend” category, but its fundamental metrics are more oriented to growth. The next table compares characteristics of DYNF and four popular passively managed growth ETFs focused on large companies:
- SPDR Portfolio S&P 500 Growth ETF (SPYG)
- Schwab U.S. Large-Cap Growth ETF (SCHG)
- Vanguard Growth ETF (VUG)
- iShares Russell 1000 Growth ETF (IWF)
|
DYNF |
SPYG |
SCHG |
VUG |
IWF |
||||||
|
Inception |
3/19/2019 |
9/25/2000 |
12/11/2009 |
1/26/2004 |
5/22/2000 |
|||||
|
Expense Ratio |
0.30% |
0.04% |
0.04% |
0.04% |
0.19% |
|||||
|
AUM |
$9.86B |
$27.35B |
$30.21B |
$251.64B |
$93.51B |
|||||
|
Avg Daily Volume |
$59.96M |
$210.56M |
$129.68M |
$341.32M |
$446.97M |
|||||
DYNF is the smallest in assets and least liquid in dollar volume. It has the most expensive fee. The next chart plots total returns since its inception. DYNF has been lagging all these growth funds, but DYNF history is short and should not be assessed on a period mostly driven by growth. Unlike the other funds, it may emphasize different factors in changing market conditions.
DYNF vs growth ETFs, since 3/21/2019 (Seeking Alpha)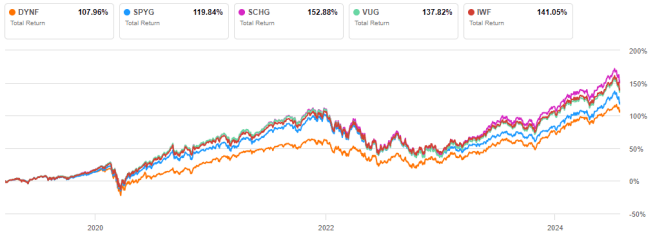
Over the last 12 months, the five ETFs are in a narrow range and DYNF comes in second position.
DYNF vs growth ETFs, 12-month return (Seeking Alpha)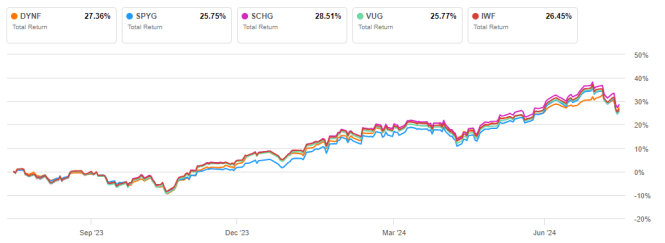
Takeaway
BlackRock U.S. Equity Factor Rotation ETF uses a rotational model including momentum, quality, value, size and minimum volatility. The factors with the highest probability of near-term outperformance are emphasized based on economic cycles and factor trends. DYNF is currently focused on growth and is overweight in technology. It has underperformed passively managed growth ETFs since its inception in 2019, but the versatility of its strategy can become an edge in uncertain market conditions.