Apple Park In Cupertino, CA P_Wei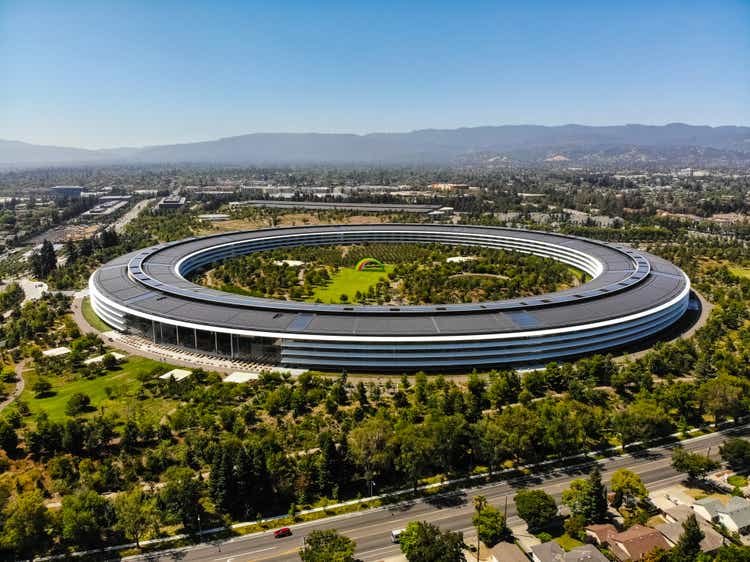
This article is a continuation of my last two Seeking Alpha articles with respect to how investors can build a well-diversified portfolio for the long-term by using a top-down allocation strategy in order to satisfy their personal considerations such as age, working/retired, goals, risk tolerance, etc. As my followers should know by now, regardless of those individual “particulars”, I advise all ordinary investors to use a low-cost S&P500 ETF as the cornerstone (i.e. largest single holding) of such a portfolio but that the portfolio should contain other investment categories as well (see the sample portfolio shown below). Today, I’ll review the Schwab U.S. Large Cap Growth ETF (NYSEARCA:SCHG) to see if it is a good choice for inclusion in the “Growth” or “Technology” categories.
| CATEGORY | ALLOCATION |
| S&P 500 | 40% |
| Income/Dividend Growth | 10% |
| Growth/Technology | 25% |
| Sector-Specific ETFs | 5% |
| Speculative Growth | 5% |
| Precious Metals | 5% |
| Cash | 10% |
Investment Thesis
As pointed out in some of my previous Seeking Alpha articles, research shows that the average investor doesn’t come close to achieving the long-term returns of the S&P500. Quoting an article on the Motley Fool (see 3 Reasons Why The Average Person Actually Stinks At Investing):
According to the 2023 Dalbar Quantitative Analysis of Investor Behavior (QAIB) study, the S&P 500 produced a 9.65% annualized total return in the 30-year period through the end of 2022. However, the average equity fund investor only managed a 6.81% return over the same period.
This is the primary reason I advise investors to build their portfolios using a low-cost S&P500 ETF as its foundation. After all, before you can “beat the market”, you first have to at least achieve the total returns of the market, right? Once that goal has been reached, motivated and ambitious investors will likely want to beat the market. That is why I advise investors to create and allocate some percentage of their investment capital to the “Growth” and “Technology” categories within their well-diversified portfolio.
Since I already covered good S&P500 and Value funds in my previous two Seeking Alpha articles (see here and here, respectively), today I will focus the SCHG ETF to see if it is a good choice for your “Growth/Technology” category. I’ll start by analyzing the top holdings in the fund.
Top-10 Holdings
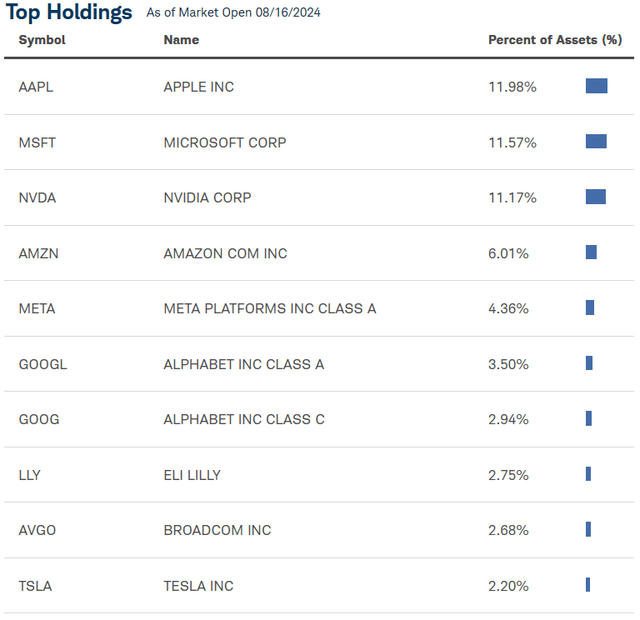
The top-10 holdings in the SCHG ETF are shown below and were taken directly from the Schwab SCHG webpage where you can learn more detailed information about the fund:
As you can see from the holdings, the SCHG ETF is a fairly concentrated fund with ~47% of the portfolio allocated to the top-5 holdings (I am combining the two classes of Alphabet stock in that 47% number). All of these top-5 companies all have some basic attributes in common: they are all cash-rich large companies that have strong global brands and generate excellent free-cash-flow.
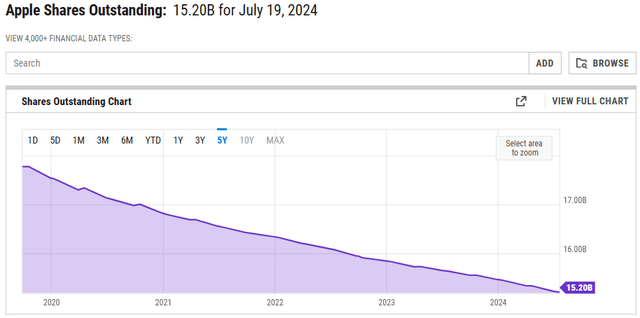
The #1 holding is Apple (AAPL) with a 12% weight. Over past recent quarters, Apple has come under increasing criticism for its lack of top-line growth. However, the company has continued to generate strong free-cash-flow and has used it to reward shareholders with dividends and stock buybacks. Indeed, in March of this year Apple announced a $110 billion stock buyback plan. That follows $90 billion buyback plans in years 2021-2023. According to Ycharts, Apple has steadily reduced its outstanding share count by 14.5% over the past 5-years:
While that is certainly a significant increase in the value of each remaining share of Apple, in my opinion it is not the most important investment thesis for Apple. What I like about Apple today is its strong platforms (iPhone, iPad, Mac, & Services) across which the company can leverage roll-outs of GenAI features to motivate its huge installed base of customers to fuel upgrade cycles.
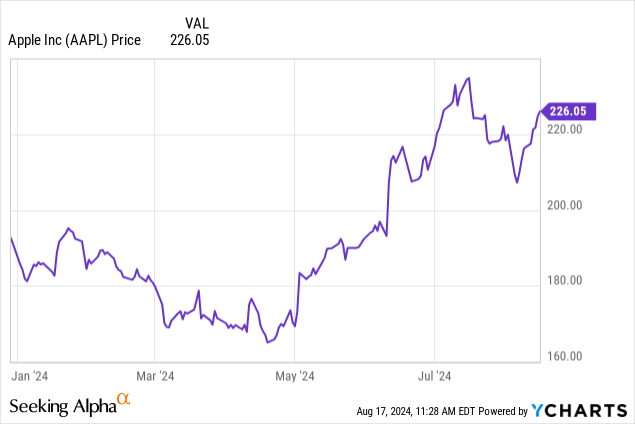
Apple could easily generate free-cash-flow of $110+ billion in FY24 and should be able to grow that at an estimated ~10% annually over the next few years. Apple reported its Q3 earnings (calendar Q2) on August 1st and ended the quarter with net-cash of $52 billion. The stock is +28% over the past year and bounced-back strongly from the recent sell-off:
The #2 holding with an 11.6% weight is Microsoft (MSFT). Microsoft released its Q4 FY24 earnings on July 30th, and although many analysts were somehow disappointed with the supposedly “weak” Intelligent Cloud growth of only 19% and MSFT’s relatively high cap-ex plan, I strongly disagree. As I pointed out in my recent Seeking Alpha article on the SPDR Technology Sector ETF (XLK):
Sure, Intelligent Cloud’s growth rate was down ~3% yoy, but on a quarter-over-quarter basis it was +6.1% to $28.5 billion. On a full-company basis, top-line revenue, Gross Margin, Operating Income, and EPS all grew double-digits, and a full-percentage point higher on a constant-currency basis.
Meantime, MSFT’s quarterly free-cash-flow of $23.3 billion grew “only” 18% despite its relatively high cap-ex spending to contonue its AI data-center infrastructure build-out. If I were a Microsoft shareholder, I would want the company to be investing in the future of GenAI because it’s either that or fall behind the other two hyperscalers (i.e. Amazon & Google).
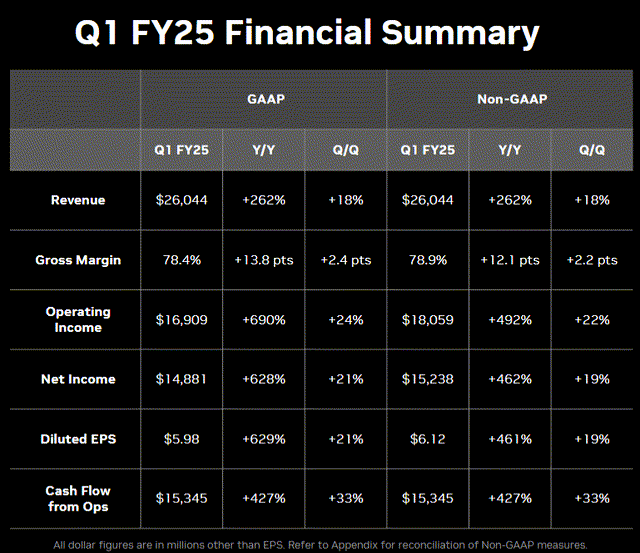
Speaking of hyperscalers, Nvidia (NVDA) is the #3 holding with a 11.2% weight. Nvidia is making a mint by selling high-margin GPUs to all three hyperscalers and many other customers as well. Nvidia announced its Q1 earnings report on May 22, and as a slide from the Q1 presentation clearly shows, it was an outstanding report:
- Revenue was +262% yoy;
- Gross margin expanded on both a yoy and qoq basis to a very impressive 78.4%;
- Net income of $14.9 billion grew a whopping 628% yoy
- EPS of $5.98 grew 629% yoy and 21% on a sequential basis.
In addition, the go-forward commentary was very bullish: demand for the H200 & Blackwell chips is well ahead of supply and the company expects demand may exceed supply well into next year. That pretty much guarantees high margins for another year. The company also said it expects Amazon, Google, Meta, Microsoft, OpenAI, Oracle, and Tesla will all adopt the next generation Blackwell GPU.
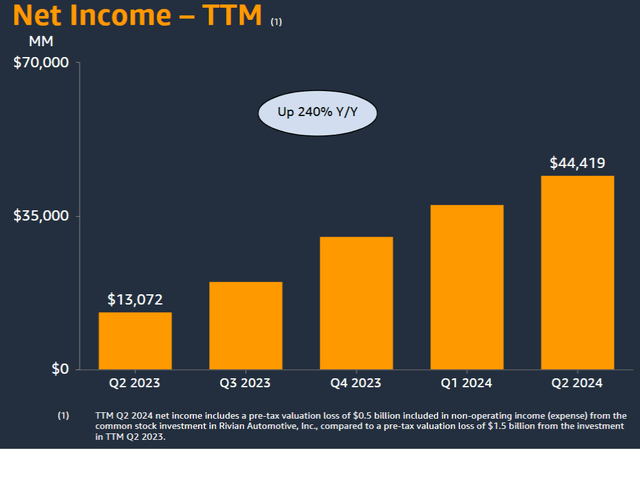
Amazon (AMZN) is the #4 holding with a 6% weight. The slide below from the company’s Q2 Presentation shows that net-income was +240% yoy as the company has finally started to show the net-income benefits of its prior heavy cap-ex investments during the pandemic to significantly increase its capacity and lower delivery times:
Amazon continues to be the leading hyperscaler on the planet as AWS quarterly revenue was $26.3 billion (+19% yoy) while AWS operating income was $9.3 billion (+74% yoy). AWS now has an annual run-rate of over $100 billion just from its AWS Segment.
Counting both classes of Alphabet stock, Google (GOOG)(GOOGL) is the #5 holding with a 6.4% weight. Google continues to be my favorite “Mag-7” tech stock with a below market average TTM P/E=23.6x despite continued strong financial returns. Despite the dire predictions that ChatGPT would somehow “kill Google Search”, Search was +14% yoy in Q2. Q2 quarterly free-cash-flow was $13.5 billion despite strong cap-ex investment into building out its AI infrastructure. Including long-term securities, Google ended Q2 with a whopping $129 billion in cash. At the current ~5% interest rate, Google’s cash and cash equivalents have the theoretical potential of generating an estimated ~$6.5 billion in annual interest income. Actual interest income in Q2 was $1.1 billion.
Earlier this month, the U.S. Dept. of Justice announced it was considering breaking up Google to address its alleged online search monopoly. An article in this weekend’s Barron’s discussed various possible scenarios (see A Google Breakup Could Be ‘Detrimental’ For Alphabet). My own view is that the DOJ is fighting last year’s war and any potential breakup is still years of litigation away – during which the AI-influenced search environment is likely to change even further away from its current status.
Along with Google, the #9 holding Broadcom (AVGO) is another of my favorite Tech stocks here. I covered that stock extensively in my last article (see MGV: The #1 Holding In Vanguard’s Mega-Cap Value ETF Will Surprise You). Hint: it was Broadcom.
The top-10 holdings are rounded out by Tesla (TSLA). If Tesla’s Q2 results were any indication, the company is arguably no longer even a “growth company”. Total revenue grew only 2% yoy while operating margin dropped a full 333 basis points yoy. Tesla is suffering from several management missteps. The company arguably missed introducing a more affordable EV for the masses, faces strong competition from Chinese EVs, and has made a big bet on the CyberTruck which, apparently, has some serious manufacturing issues with regard stainless steel, which also has been reported to rust. As Elon Musk himself famously said:
We Dug Our Own Grave With Tesla Cybertruck
I couldn’t agree more. With a TTM P/E = 60.5x, Tesla appears to be massively over-valued in comparison to its growth rate.
From an overall portfolio perspective, the SCHG ETF is, obviously, most highly exposed to the Technology Sector. The top-5 sector weightings are shown below:
Schwab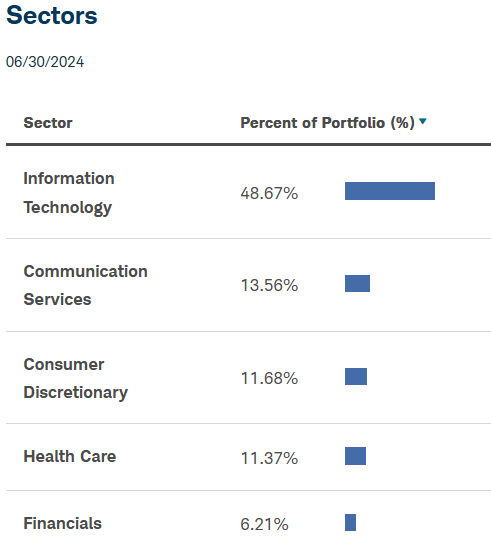
Performance
As mentioned earlier, the SCHG ETF has a very strong long-term performance track record, delivering an average annual return over the past 10-years of a very impressive 16.3%:
Note that SCHG significantly beat the S&P500’s average annual 10-year return of 13.1%
The chart below compares the 5-year total returns of the SCHG ETF with some other tech-oriented competitors, including the Invesco Nasdaq-100 Trust (QQQ), the Fidelity MSCI IT ETF (FTEC), and the SPDR Technology Sector ETF (XLK):
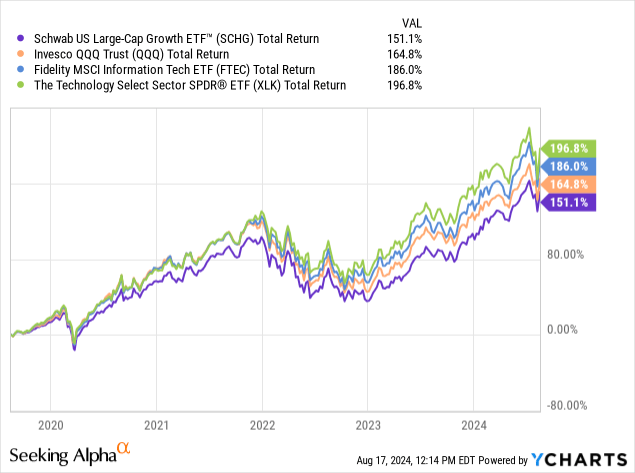
As you can see in the comparison, although the SCHG ETF’s 151% return is quite impressive as compared to the broad market averages, it comes in last as compared to those in the chosen comparison group. The SPDR XLK tops the list, outperforming FTEC by close to 10%+ over the past five years and, perhaps even more impressively it outperformed the QQQ’s by 32% over that time frame.
Risks
The SCHG ETF is highly exposed to the U.S. and global macro-economic and geopolitical environment due to its over-weighting in the high-growth technology sector. The chart above shows the pounding the SCHG ETF took during the 2022 Tech bear-market. That said, the chart also shows the rapid bounce-back and excellent returns since the start of 2023. Indeed, in the Fall of 2022, I pounded the table on Tech stocks (and SCHG) with the Seeking Alpha article SCHG: It’s Time To Buy Big-Tech. Since that article was published, SCHG outperformed the S&P500 by almost 24%.
Given the current macro environment, I advise investors who want to establish positions in the SCHG ETF (or XLK, FTEC, or QQQ funds …) to do so slowly and to scale in over a period of weeks, months, or even years. For example, it took me ~3-years to establish a full-position in the QQQ’s.
Summary & Conclusions
The SCHG ETF has a very strong 10-year performance track record and with an expense fee of only 0.04% is a very cost-effective vehicle to gain direct exposure to the Tech Sector. The fund is over-weighted in the best large-cap Tech growth stocks, all of which are cash-rich, have established strong global brands, and generate excellent free-cash-flow. While I rate the fund a BUY, as part of my effort to simplify my portfolio (and hopefully increase returns ..) by reducing the total number of my equity holdings, I sold my position in SCHG and moved the proceeds into better performing existing positions in the QQQ and FTEC funds.


