

Market risk along with credit and duration risks explain a large part of bond market and bond exchange-traded fund returns. Yet factor-based strategic-beta bond ETFs are few and far between. Compared with the vast universe of strategic-beta stock ETFs, investors’ options for bond ETFs are limited. Most bond ETFs offer either pure passive exposure to markets or market segments, or fully discretionary active strategies.
But that could change. There’s a growing interest in bond ETFs, and the necessary data is becoming more widely accessible.
What’s the Holdup?
Factor investing relies on extracting signals from a vast array of data to work its magic. But there are hurdles to overcome. Many bonds trade infrequently, others lack prices that are easy to access, and complicated debt structures render the bond market much more opaque than the stock market.
Nonetheless, there are still opportunities, and those opportunities are improving. The increased adoption of electronic trading platforms that communicate prices quickly and efficiently have helped improve the accuracy of bond prices, and the Trade Reporting and Compliance Engine database requires reporting for many bond transactions. Both have opened new doors for strategic-beta ETFs to break into the bond market.
Certain sectors are more ripe for this than others. Higher levels of issuer-specific risks and fewer trading opportunities make high-yield corporate bonds prime candidates for factor investing compared with government bonds or investment-grade credit.
Quality as a Common Factor
Most strategic-beta high-yield ETFs take one of two routes. They either focus on screening out distressed issuers to search for quality beyond backward-looking credit ratings, or they maximize yields while keeping risk in check. Exhibit 1 displays four of the largest strategic-beta bond ETFs in the high-yield bond Morningstar Category.
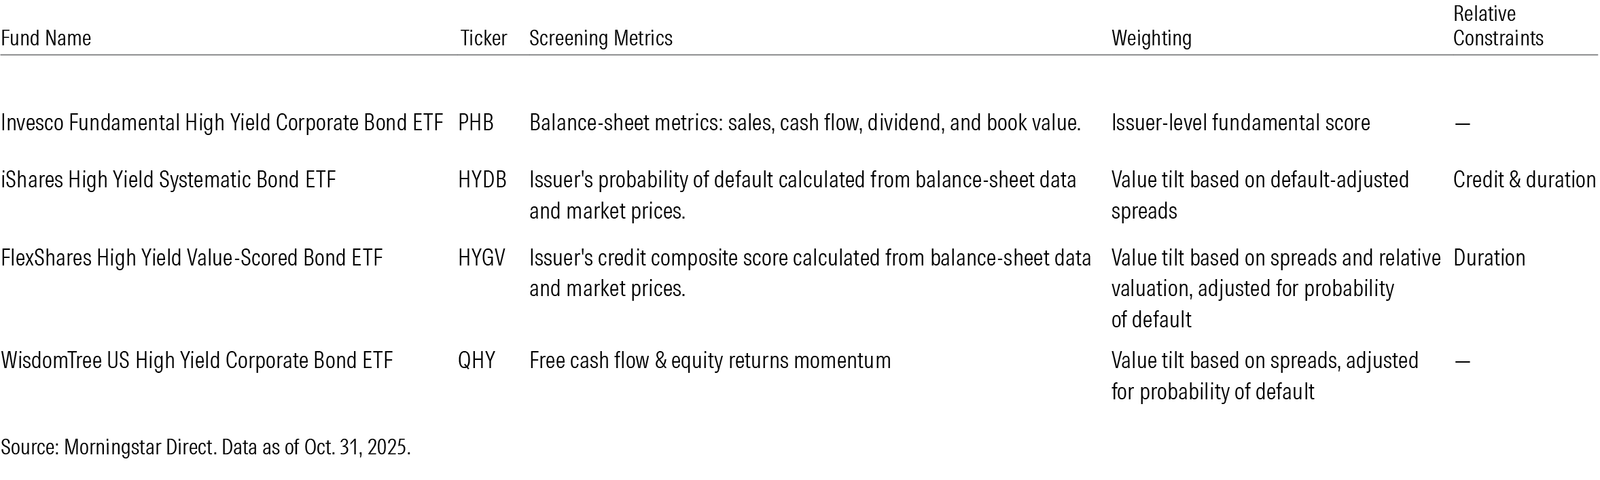
All four ETFs start their process with balance-sheet metrics at the issuer level to screen out companies with deteriorating fundamentals. While the exact metrics used might differ slightly, the core idea of removing bonds with higher credit risk or probability of default is the same.
IShares High Yield Systematic Bond ETF HYDB and FlexShares High Yield Value-Scored Bond ETF HYGV both calculate a proprietary composite score to get at an issuer’s financial health. The score is based on a combination of their balance-sheet data and the market prices of their stock. Meanwhile, WisdomTree US High Yield Corporate Bond ETF QHY excludes issuers with poor free cash flow, except for those with strong momentum or recent positive stock returns. All three use a value tilt to weight their constituents.
Invesco Fundamental High Yield Corporate Bond ETF PHB is the only one that does not account for recent price activity in its fundamental scoring. Instead, it opts for a score based on an issuer’s sales, book value, dividends, and cash flow. It also uses that fundamental score to weight its holdings.
Weighting by fundamentals distinguishes PHB from the other three. It could shift the ETF toward companies with stronger fundamentals, which should help place higher-quality bonds front and center. But they are less than perfect. While these metrics can identify issuers with deteriorating fundamentals whose bond prices have yet to reflect their realities, they don’t capture the full spectrum of risk for individual bonds.
Besides overweighting bonds from fundamentally sound issuers, PHB excludes all bonds rated below B and makes room for those straddling the BBB and BB threshold between investment-grade and high-yield. As a result, this ETF tends to err on the safer side of the category index and its average peer.
Unlike stocks, bonds from the same company are not interchangeable. An issuer’s credit rating typically anchors the bond’s credit rating, but this is only one facet of their risk profile. Issuer-level data does not capture a bond’s yield or duration characteristics, nor any potential mispricing. PHB’s fundamental scoring saved it from the worst of recent credit stress periods, such as March 2020, but it failed to keep its return in step during the ensuing rebounds. The ETF has other quirks to blame, but a large part of its since-inception underperformance comes from its overly simplistic approach.
Beyond Issuer-Level Metrics
On the other hand, the other three ETFs on the list seek to offer more than just a baseline credit risk screening. They use bond-level spreads and valuations data to tilt their portfolios toward names that offer more attractive valuations. HYDB and HYGV both use an optimizer to maximize their portfolios’ value tilts, as measured by default-adjusted spreads for HYDB and a composite score of relative valuations, spreads, and solvency for HYGV. QHY adopts a simpler approach. It ranks bonds by a measure of default-adjusted spreads within their sector and excludes the lower-ranking ones while doubling down on cheaper issues.
All three ETFs paint broad strokes to create a similar picture, but small details in each methodology can produce meaningful differences in their final portfolios.
HYDB tethers its duration and credit risk (measured by option-adjusted duration, duration-times-spread, and yield-to-worst) to its broad-market starting universe. This keeps its active risk in check while it hunts for attractively priced bonds. The ETF’s composition does not stray too far from the category index, despite carrying a value tilt. Since its 2017 inception, HYDB managed to capture less of the index’s downside during most of the major stress periods while squeezing out slightly more gains during credit rallies. Its attractive absolute and risk-adjusted returns came from taking advantage of credit spreads to find more attractive bonds while staying within the broad contours of credit and duration risk.
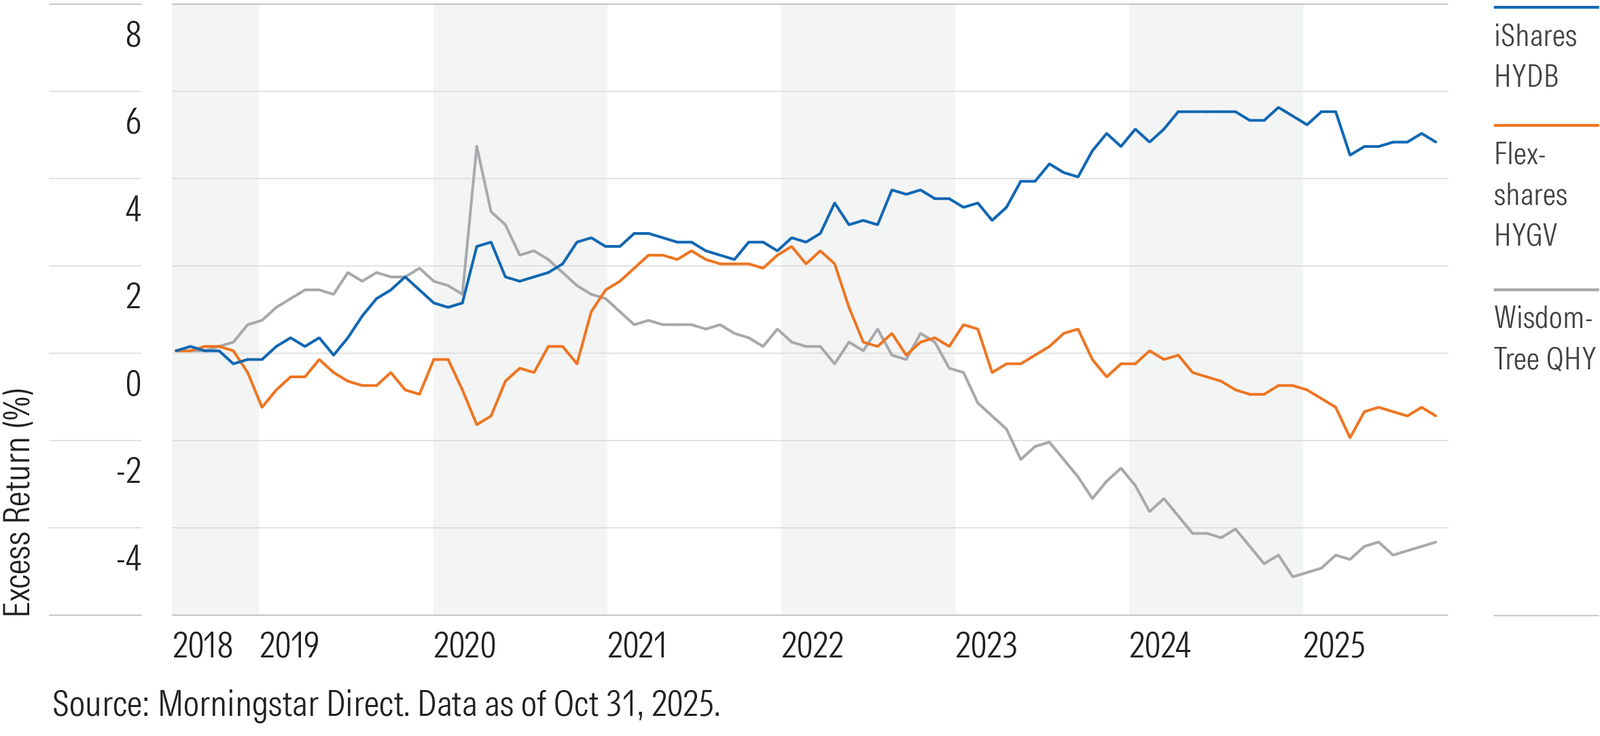
In comparison, HYGV’s looser constraints let it ramp up credit risk substantially. Its stake in bonds rated below B have remained above 20% from its inception through 2022, or double that of the category index. The ETF has reined in these risks in recent years as credit spreads started to tighten across the board, but not before it suffered major dents in its return during the 2022 market meltdown and the March 2020 pandemic shock.
QHY also does not tie its risk/reward profile to those of the broader high-yield market. As a result, its weighting scheme and stock momentum screen have resulted in noticeable portfolio tilts at times. For instance, the fund’s average duration hovered around 0.5 years longer than that of the category index for most of 2023 and 2024. This did not bode well for the fund when long-term yields spiked in September and October 2023 as it trailed the category index and the other three strategic-beta ETFs.
Factors of the Future
Most strategic-beta bond ETFs still rely on publicly available stock data to construct their portfolio. It’s possible that more innovative approaches will show up as bond-level data becomes easier to access in the future. Trading over the phone may never fully go away, but electronic platforms are claiming an ever-larger share of bond transactions. That development should help improve the speed and efficiency of pricing bonds to accurately reflect all available information.
Leveraging data in the right way can help a portfolio get closer to approximating the labor-intensive process of credit research that active managers have long been able to use to their advantage. It could also help expand the breadth of strategic-beta bond ETFs, as issuer-level data limits the eligible scope to public issuers whose balance sheets and stock prices are readily available and easily accessible. As more of these ETFs make their way in the world, investors should keep in mind the lessons taught by the pioneering efforts highlighted above: understand the active risks the fund is taking and make sure to keep an eye on stray bets.