

Bank advisors know this rhythm well. If you have cash sitting idle, there is a good chance you have received a call inviting you to review your financial plan or come into a branch. The objective is usually the same: get that cash invested into one of the bank’s in-house products.
For older clients, or those flagged through the know-your-client process as having a lower risk tolerance, the conversation often shifts toward market-linked guaranteed investment certificates (GICs). These products are typically presented as a way to participate in stock market gains while keeping your principal protected.
That pitch has worked for decades. But in 2026, market-linked GICs are no longer the only way to get that type of payoff. Exchange-traded funds (ETFs) have entered the same territory with products commonly called buffer ETFs. Like market-linked GICs, buffer ETFs are designed to limit downside risk while offering some participation in market gains.
As a retail investor, it is reasonable to be cautious here. Added complexity often comes with higher costs, more fine print, and a steep learning curve. When investors own products they do not fully understand, it becomes harder to stay invested through normal market ups and downs, regardless of how the product is designed to work.
Here is what you need to know about buffer ETFs and market-linked GICs in 2026. That includes the key trade-offs, the costs that are easy to overlook, and my honest take on whether either option makes sense for risk-averse investors, beginners and veterans alike.
How market-linked GICs work
A market-linked GIC’s principal is protected if you hold the investment to maturity, and it is typically eligible for Canada Deposit Insurance Corporation (CDIC) coverage, subject to the usual limits. The difference shows up in how your return is calculated.
Instead of earning a fixed interest rate for the full term, the return on a market-linked GIC depends on the performance of a specific market benchmark. That benchmark could be a stock index or another predefined group of securities. If the benchmark performs well, your return increases. If it performs poorly, your return falls back to a guaranteed minimum.
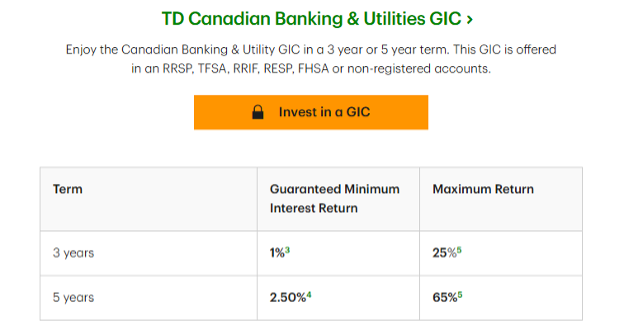
To see how this works in practice, consider the market growth GICs offered by TD Bank. One option is linked to a basket of major Canadian banks and is available in three-year and five-year terms in most registered accounts.
Source: TD, January 2026
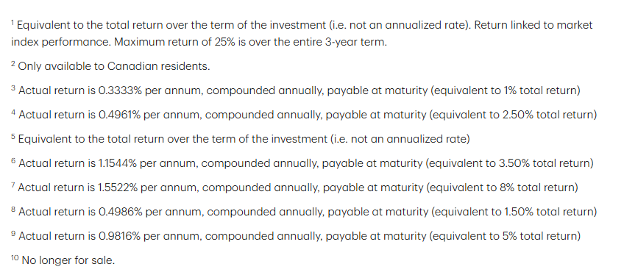
For the three-year version, the guaranteed minimum return is 3.5%. For the five-year version, the guaranteed minimum return is 8%. If the linked bank basket performs poorly, that minimum is what you receive at maturity. You cannot lose money as long as you hold the GIC to the end of the term.
However, the upside participation is capped. Over three years, the maximum cumulative return is 18%. Over five years, the maximum cumulative return is 32%. Importantly, these figures are not annualized. They represent the total return over the entire life of the investment.
The fine print matters here. TD discloses that the 8% minimum return over five years works out to about 1.55% per year. The same logic applies to the maximum return. A 32% total return over five years sounds attractive, but once translated into an annualized figure, it looks far more modest.
Source: TD, January 2026
This structure highlights the core trade-off. You are free of downside risk, but you also give up a large portion of the upside. If the underlying market performs exceptionally well, the return above the cap does not accrue to you.
That leads to the obvious question of incentives. Banks earn fees for structuring and distributing these products. This is part of the reason market-linked GICs can be attractive for issuers even when they appear conservative on the surface.
Another common issue is investor misunderstanding. Many people confuse cumulative returns with annualized returns and assume the headline numbers are yearly figures; others assume the maximum return is what they are likely to receive, when in reality it is simply the upper boundary. Actual outcomes can land anywhere between the guaranteed minimum and the cap, depending entirely on how the underlying benchmark performs over the term.