

SIP investors are going through a tough phase. Markets appear weak in the face of some significant economic realities. The Sensex has plummeted over 10% from its recent highs, and, more concerning for SIP investors, it is now around 76,400 — the same level as in June 2024. Some SIP investors could even be sitting on losses, particularly those who have started investing recently.
For SIPs to work to your advantage, you need to be in it for the long haul. Experts advocate to ‘invest for the long term’ — but what exactly does that mean? Is there a specific number of years that counts as ideal?
The answer, it turns out, is yes.
Ideal Duration for SIPs
A study conducted by WhiteOak Capital Mutual Fund attempts to find the ‘ideal’ duration that can work in favour of SIP investors. Two things stand out clearly.
First, short SIPs of 3–5 years carry real downside risk — you could actually lose money. While the median return has been around 14% on SIPs of 3–5 years, the probability of gaining a positive return is less than 100%.
Second, once you cross 8 years, while the median return remains around 14%, the minimum return turns positive. And by 10 years, the SIP has delivered positive returns 100% of the time historically.
What is most striking is that the average and median returns stay relatively stable across all durations — around 14–16%. This means longer SIPs do not end up with lower returns but rather reduce the probability of negative returns. In other words, staying invested longer doesn’t hurt your returns — it simply makes a bad outcome less likely.
Here’s what the rolling return data reveals across different SIP durations:
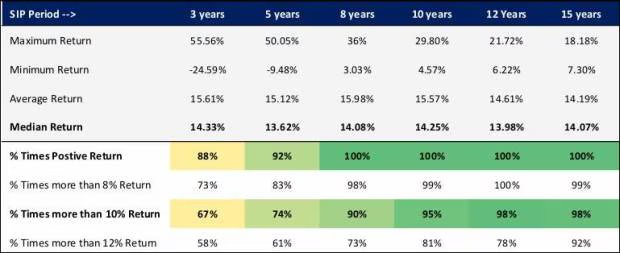
Source: WhiteOak Capital Mutual Fund SIP Analysis Report, May 2026; %XIRR Rolling Returns on a monthly basis for BSE SENSEX TRI for SIP between August 1996 and April 2026.
Key Takeaways
In a nearly 30-year dataset analyzing SIPs, 8 years emerges as a crucial threshold. Investments held for shorter periods carry the potential for negative outcomes. However, SIPs held for 8 years or more have consistently resulted in positive returns.
At the 10-year mark, consistency in returns peaks, with a 95% probability of earning above 10%. This likelihood increases to 98% for timeframes extending to 12 to 15 years.
Also worth noting are the best and worst outcomes for an investor who invested on any day during this 30-year period. The maximum returns for 10, 12, and 15 years were 29.80%, 21.72%, and 18.18%, respectively, while the minimum returns were 4.57%, 6.22%, and 7.30%, respectively. Even in the worst case, a 15-year SIP investor never lost money — and earned at least 7.30%.
One more thing to keep in mind: even over a longer period, be prepared for lower returns than benchmarks if you choose the wrong fund.
Why Rolling Returns Are a Better Yardstick
When the time period is more than a year, mutual fund returns are typically shown as CAGR. CAGR is useful but has a limitation — it only uses the start and end dates, so it may not reflect what an investor who began mid-way through a period actually experienced.
Rolling returns solve this problem. They are a sequence of point-to-point returns computed between two time periods at set intervals — daily, monthly, and so on. They give a fuller, more honest picture of how a fund has performed across different market conditions and entry points.
Volatility Is a Friend of SIP Investors
Equity markets are inherently volatile — but as several studies have shown, they tend to drift upwards over the long term. Market downturns, such as corrections or crashes, can actually work in a long-term SIP investor’s favour. When markets fall, your monthly SIP buys more mutual fund units at lower prices, bringing down your average purchase cost. Smart investors often capitalize on these situations by increasing their investments.
The bottom line: don’t let short-term market weakness shake your SIP discipline. Time in the market — ideally 10 years or more — is what turns volatility from a threat into an advantage.
Disclaimer: Mutual fund investments are subject to market risks. Past performance is not indicative of future results. The data and analysis referenced in this article are based on the WhiteOak Capital Mutual Fund SIP Analysis Report (May 2026) using BSE Sensex TRI data from August 1996 to April 2026. Returns mentioned are historical rolling returns on the Sensex TRI and may not be replicated in individual mutual fund schemes. SIP does not guarantee a profit or protect against loss in declining markets. Investors are advised to consult a SEBI-registered financial advisor before making investment decisions.