

William_Potter
Investment Thesis
Higher uncertainty and elevated market volatility can be excellent times to start building a dividend portfolio since companies with strong competitive advantages can be available at a reduced price.
In today’s article, I will show you how you can build a diversified dividend portfolio with only three ETFs and three stocks, allocating the amount of $100,000.
This dividend portfolio offers investors a Weighted Average Dividend Yield [TTM] of 3.90%, indicating it to be adequate for the generation of dividend income. This allows you to get paid a substantial number of dividends while aiming for favorable investment outcomes.
At the same time, the portfolio provides investors with a 5-year Weighted Average Dividend Growth Rate [CAGR] of 8.69%. This number indicates a strong potential for dividend growth, particularly attractive for younger investors that are willing to invest with a long investment horizon.
By combining effectively dividend income and dividend growth within your portfolio, you not only ensure steadily increasing dividend payments to increase your wealth year-over-year, but you also position your portfolio for different market environments. I am following such an investment approach myself while constructing The Dividend Income Accelerator Portfolio. The portfolio presently delivers investors a Weighted Average Dividend Yield [TTM] of 4.57% and a 5-Year Weighted Average Dividend Growth Rate [CAGR] of 7.41%, merging effectively dividend income and dividend growth.
Within this analysis, I will show you in greater detail the company-specific allocation risk of this portfolio when allocating the selected ETFs Schwab U.S. Dividend Equity ETF (SCHD), Vanguard S&P 500 ETF (VOO), and JPMorgan Nasdaq Equity Premium Income ETF (JEPQ) across the companies they are invested in. This is important to ensure that no company is overrepresented. Such an overrepresentation of a single company (especially one with an elevated risk level) would increase the degree of portfolio risk. Reducing portfolio risk is crucial for increasing the likelihood of favorable investment outcomes, which is why I focus on conducting a detailed portfolio risk-management analysis in this article.
Overview of the Current Composition of This Dividend Portfolio
|
Symbol |
Name |
Sector |
Industry |
Dividend Yield [TTM] |
Payout Ratio |
Dividend Growth 5 Yr [CAGR] |
Allocation |
Amount in $ |
|
SCHD |
Schwab U.S. Dividend Equity ETF |
ETF |
ETF |
3.50% |
12.88% |
55.00% |
55000 |
|
|
VOO |
Vanguard S&P 500 ETF |
ETF |
ETF |
1.35% |
4.40% |
25.00% |
25000 |
|
|
JEPQ |
JPMorgan Nasdaq Equity Premium Income ETF |
ETF |
ETF |
9.73% |
– |
10.00% |
10000 |
|
|
O |
Realty Income Corporation |
Real Estate |
Retail REITs |
5.22% |
74.15% |
3.55% |
3.33% |
3330 |
|
ARCC |
Ares Capital |
Financials |
Asset Management and Custody Banks |
9.46% |
79.34% |
3.97% |
3.33% |
3330 |
|
VICI |
VICI Properties Inc. |
Real Estate |
Other Specialized REITs |
5.27% |
66.22% |
7.62% |
3.33% |
3330 |
|
3.90% |
8.69% |
100% |
100000 |
Source: The Author, data from Seeking Alpha
Risk Analysis of the Portfolio Allocation per Company/ETF
I have selected Schwab U.S. Dividend Equity ETF as the largest position of this dividend portfolio due to its attractive risk-reward profile and its effective merger of dividend income and dividend growth. SCHD, which represents 55% of this dividend portfolio, pays a Dividend Yield [TTM] of 3.59% and has a 5-year Dividend Growth Rate [CAGR] of 12.88%.
The second-largest position is Vanguard S&P 500 ETF, representing 25%. This ETF pays a Dividend Yield [TTM] of 1.39% while it has shown a 3-Year Dividend Growth Rate [CAGR] of 7.78%.
The third-largest position in this portfolio is JEPQ, which accounts for 10%. This ETF pays investors a Dividend Yield [TTM] of 10.01% and is an important strategic element for producing dividend income.
The individually selected companies are Realty Income, VICI Properties, and Ares Capital. All three share the fact that they pay an attractive number of dividends, contributing to increasing the portfolio’s Weighted Average Dividend Yield. Moreover, they have shown significant dividend growth in recent years, have a Payout Ratio below 80%, have an attractive risk-reward profile, and none of the selected ETFs hold a significant stake in these companies, ensuring that the portfolio has a reduced company-specific allocation risk.
Source: The Author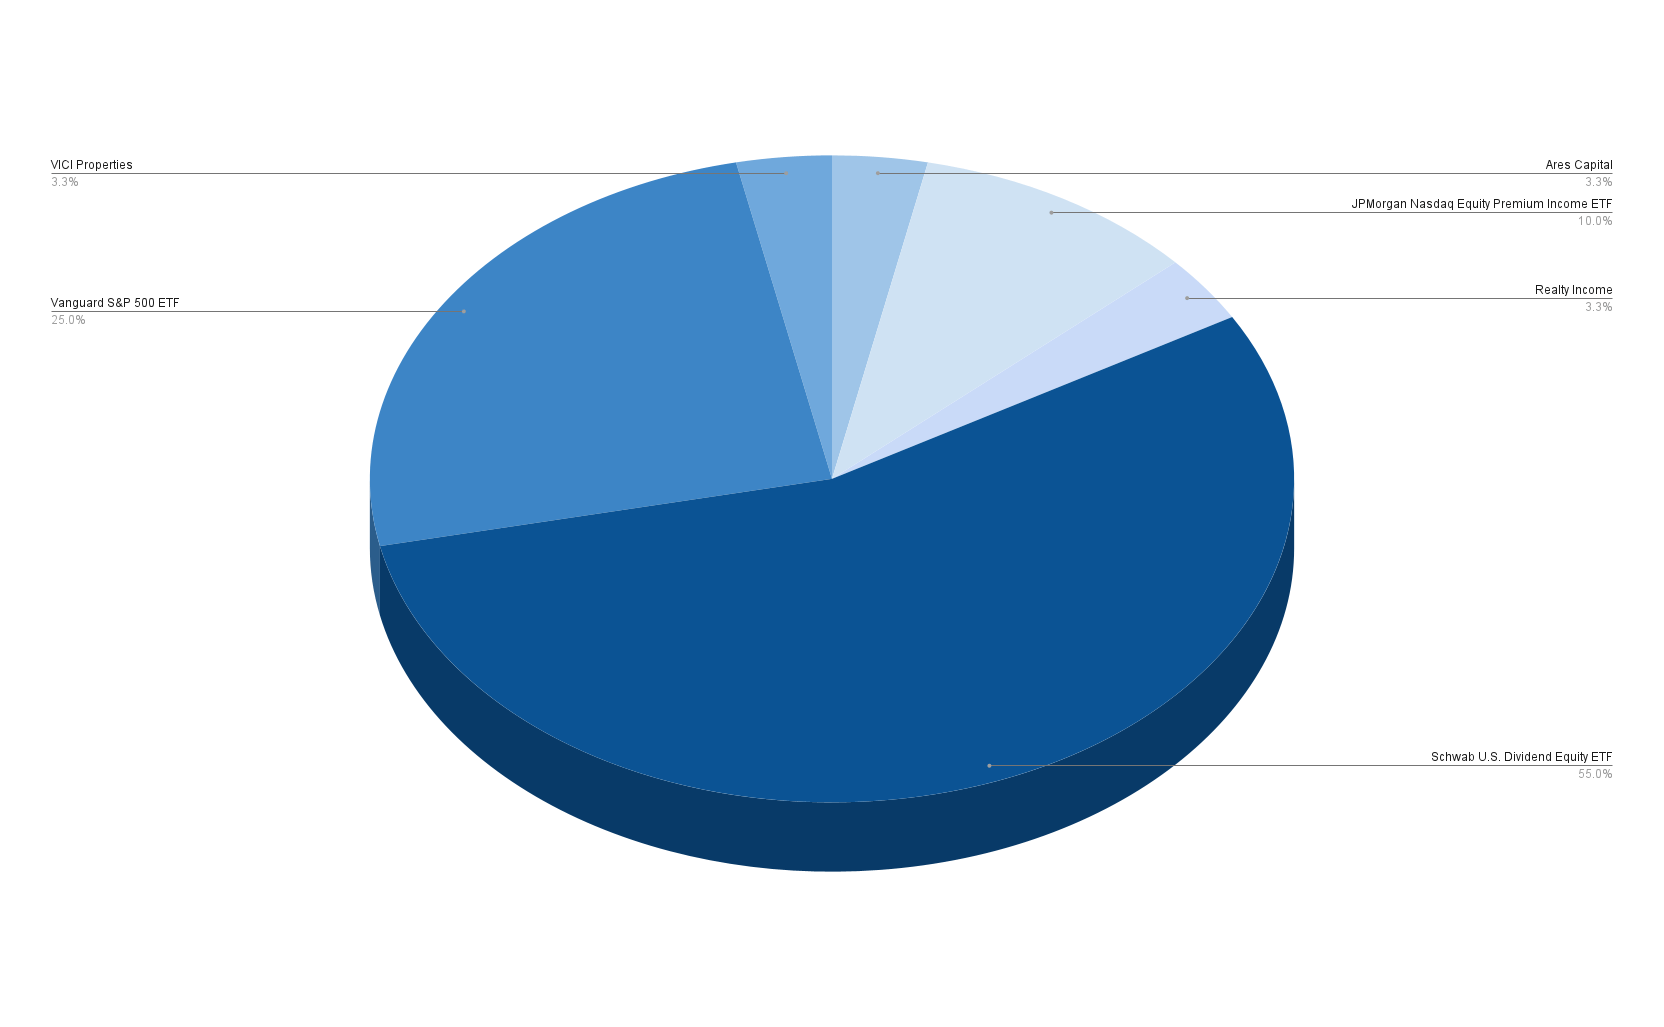
The 10 Largest Positions of This Dividend Portfolio
The below companies represent the largest positions of this dividend portfolio when allocating SCHD, VOO, and JEPQ across the companies they are invested in:
Realty Income
With a percentage of 3.48%, Realty Income Corporation (O) is in the largest position in this dividend portfolio when distributing SCHD, VOO, and JEPQ across the respective companies they are invested in.
The company offers investors a Dividend Yield [FWD] of 5.33% and a 5-year Dividend Growth Rate [CAGR] of 3.55%, merging dividend income and dividend growth. In addition to that, I believe Realty Income is an appealing risk-reward choice, which makes the company an excellent candidate to be a core element of this dividend portfolio.
VICI Properties
VICI Properties Inc. (VICI) presently pays a Dividend Yield [FWD] of 5.40%, which is especially attractive when considering the company’s relatively low Payout Ratio of 65.22% and its 5-year Dividend Growth Rate [CAGR] of 7.62%. VICI Properties makes up 3.43% of this dividend portfolio, representing the second-largest position.
Ares Capital
With a proportion of 3.33%, Ares Capital (ARCC) is the third-largest position in this dividend portfolio. The company presently pays an attractive Dividend Yield [FWD] of 9.70%, which makes it an important strategic element for generating dividend income.
Microsoft
With a proportion of 2.53%, Microsoft Corporation (MSFT) is the fourth-largest position in this dividend portfolio. I recently published an article about the latest earning results from the company, underscoring my current buy rating for Microsoft and highlighting its potential to contribute to a portfolio’s dividend growth potential.
AbbVie
With a proportion of 2.49%, AbbVie Inc. (ABBV) is presently in the fifth-largest position in this dividend portfolio. With a current Dividend Yield [FWD] of 3.36% and a Payout Ratio of 57.29%, the company is attractive for dividend income and dividend growth investors.
The Home Depot
The Home Depot, Inc. (HD) represents 2.45% of this dividend portfolio. The company is particularly attractive for this portfolio due to its strong dividend growth metrics. It provides investors with a relatively low Payout Ratio of 58.22% and a 5-year Dividend Growth Rate of 12.67%. Both metrics indicate strong potential for dividend growth.
Apple
As the seventh-largest position of this dividend portfolio, Apple Inc. (AAPL) accounts for 2.41%. I recently published an article about Apple’s latest earnings results, in which I reaffirmed my buy rating for the company from Cupertino, and further underlined its currently fair valuation.
Lockheed Martin
As the eighth-largest position, Lockheed Martin Corporation (LMT) accounts for 2.40% of this portfolio. With 21 Consecutive Years of Dividend Growth and a 5-year Dividend Growth Rate of 7.68%, the company offers strong dividend growth from which investors can benefit.
Amgen
Amgen Inc. (AMGN) represents 2.38% of this portfolio. The company provides investors with an attractive mix of dividend income and dividend growth, indicated by its Dividend Yield [FWD] of 2.77% and 5-year Dividend Growth Rate [CAGR] of 9.60%.
Coca-Cola
The Coca-Cola Company (KO) accounts for 2.35% of this dividend portfolio. The company has shown 61 Consecutive Years of Dividend Growth, highlighting its rock-solid dividend. With a 24M Beta Factor of 0.39, the company can effectively contribute to reducing portfolio volatility.
The chart below shows the largest positions of this dividend portfolio when allocating SCHD, VOO, and JEPQ across their respective companies.
Source: The Author, data from Seeking Alpha and Morningstar
Risk Analysis
Analyzing the Dividend Yield [TTM] of the 10 Largest Positions of This Dividend Portfolio
From the 10 largest positions (when distributing the ETFs across their respective companies) of this dividend portfolio, Ares Capital, VICI Properties, and Realty Income contribute most to the generation of dividend income.
While Ares Capital presently pays a Dividend Yield [TTM] of 9.46%, VICI Properties’ Dividend Yield [TTM] is 5.27%, and Realty Income’s is 5.22%. Cisco Systems’ and AbbVie’s Dividend Yield stand at 3.39% and 3.24%, respectively.
Source: The Author, data from Seeking Alpha![Dividend Yield [TTM]](https://fundfocusnews.co.uk/wp-content/uploads/2024/08/55029283-17231274533210435.png)
Analysis of the Payout Ratios of the 10 Largest Positions of This Dividend Portfolio
The chart below indicates that seven of the ten largest positions of this dividend portfolio exhibit Payout Ratios below 60%. This indicates strong dividend growth potential for the companies that represent the largest proportion of this dividend portfolio.
The companies with the lowest Payout Ratios are Apple (14.76%), Microsoft (25.40%), Cisco Systems (39.25%), Lockheed Martin (44.29%), Amgen (46.38%), AbbVie (57.29%), and The Home Depot (58.22%). I believe that each of these companies will significantly contribute to the portfolio’s dividend growth potential in the following years.
Source: The Author, data from Seeking Alpha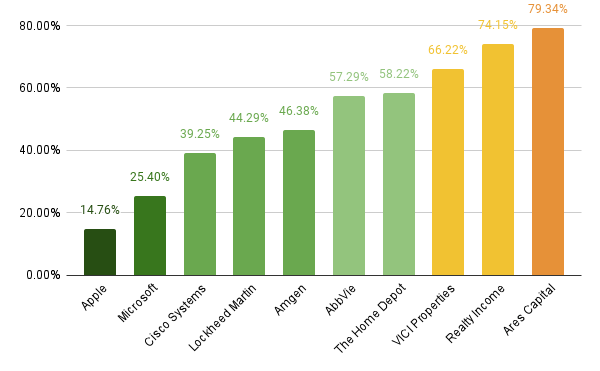
Analysis of the 5-Year Dividend Growth Rates of the 10 Largest Positions of This Dividend Portfolio
The strong dividend growth potential of the selected portfolio is further underlined through the 5-Year Dividend Growth Rates of the 10 largest positions. The Home Depot exhibits the highest 5-Year Dividend Growth Rate of 12.67% among the 10 largest positions, followed by Microsoft (with 10.23%), Amgen (9.60%), AbbVie (8.01%), Lockheed Martin (7.68%), VICI Properties (7.62%), and Apple (5.56%).
Source: The Author, data from Seeking Alpha![5-Year Dividend Growth Rate [CAGR]](https://fundfocusnews.co.uk/wp-content/uploads/2024/08/55029283-17231276945371413.png)
Risk Analysis of the Portfolio’s Sector-Specific Concentration Risk When Distributing SCHD, VOO, and JEPQ Across their Sectors
When conducting a risk analysis of the portfolio’s sector-specific concentration risk, it can be highlighted that the Information Technology Sector represents the largest sector with a share of 17.49% of the overall portfolio. This sector is followed by the Financials Sector (with 16.68%), the Health Care Sector (12.62%), the Consumer Staples Sector (9.99%) and the Industrials Sector (9.70%).
The sixth-largest sector is the Consumer Discretionary Sector with 9.65%, followed by the Energy Sector (7.87%), the Real Estate Sector (7.58%), the Communication Services Sector (6.13%), the Materials Sector (1.56%), and the Utilities Sector (0.73%).
Source: The Author, data from Seeking Alpha and Morningstar
With no sector representing more than 18% of the overall portfolio and a relatively equal distribution of the different sectors, a reduced sector-specific concentration risk is indicated which is a sign of a reduced overall risk level, thus elevating the chances for favorable investment results.
Conclusion
The objective of this dividend portfolio article was to show you how you can build a dividend portfolio with only three ETFs and three individual stocks.
I have shown you that with three ETFs and three individual picks, you can effectively build a dividend portfolio with extensive diversification across sectors and reduced sector-specific allocation risks.
I have also demonstrated that with only these six picks, you can effectively combine dividend income and dividend growth. This is underscored by the portfolio’s Weighted Average Dividend Yield [TTM] of 3.90% and its 5-year Weighted Average Dividend Growth Rate [CAGR] of 8.69%. When building a portfolio with ETFs and individual picks, you can benefit from the advantages of broad diversification via ETFs and the advantages of higher yielding single positions with attractive risk-reward profiles, combining the best of both worlds.
If you aspire to a portfolio with a superior capacity to produce dividend income, you might consider following the investment approach of The Dividend Income Accelerator Portfolio. The portfolio provides investors with a Weighted Average Dividend Yield [TTM] of 4.57% and a 5-year Weighted Average Dividend Growth Rate [CAGR] of 7.41%, merging dividend income and dividend growth.
I believe portfolios that effectively blend dividend income and dividend growth can perform well across various market cycles. This allows you to aim for an attractive Total Return while investing with a reduced risk level, and to get paid a significant amount of extra income that you can increase on an annual basis. This helps you to constantly increase your wealth independently of macroeconomic risk factors and the volatility of the broader stock market in uncertain times.
What do you think about implementing an investment approach that combines both dividend income and dividend growth at the same time?