

Fund of Funds (FoFs) based on gold ETFs and silver ETFs have emerged as a convenient route for retail investors to gain exposure to precious metals. They are especially popular among investors who do not have demat accounts or prefer investing in a staggered manner through systematic investment plans (SIPs).
In theory, FoFs should closely follow their underlying ETFs, which in turn aim to mirror domestic gold or silver prices. Since FoFs invest entirely in units of the corresponding ETF, investors reasonably expect returns to be broadly similar across the metal, the ETF, and the FoF. But does this hold true in practice?
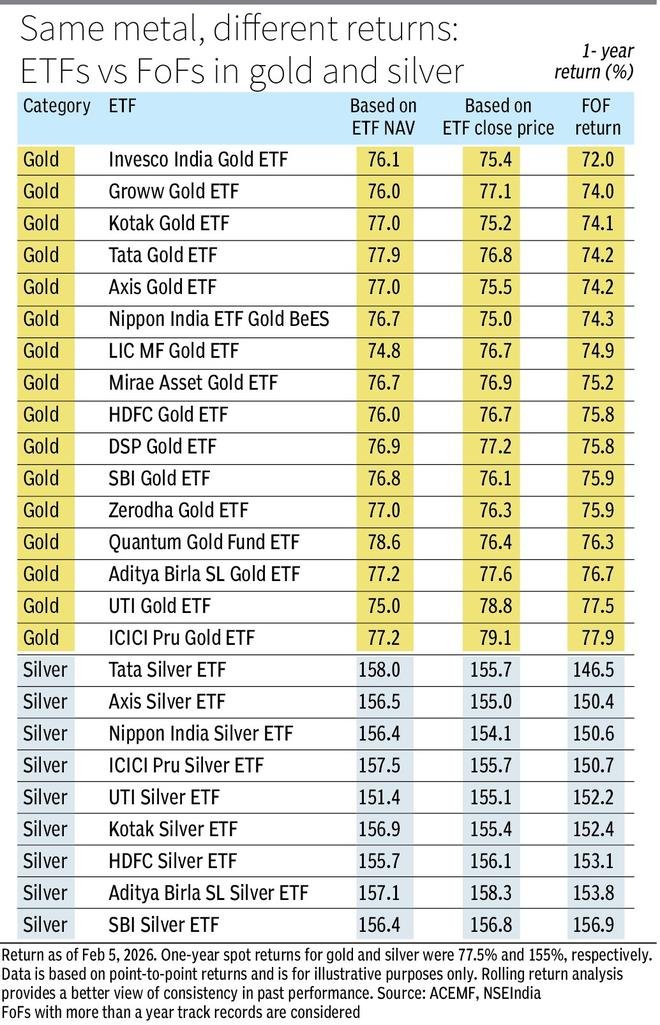
Data compiled from ACEMF suggests otherwise. For the one-year period ended February 5, 2026, domestic gold prices rose about 77.5 per cent — a return largely matched by gold ETFs. However, gold FoFs delivered returns ranging from 72 per cent to 78 per cent.
The gap is even wider in silver. While domestic silver prices surged about 155 per cent and silver ETFs broadly reflected this rally, silver FoFs posted returns ranging between 147 per cent and 157 per cent.
While this is a single-point observation, a rolling one-year return analysis based on data from the past two years reveals a similar pattern. Interestingly, the return divergence is not constant across market cycles. It tends to widen sharply during strong rallies and narrow during relatively stable or normal market conditions.
Here, we analyse two aspects: first, return divergence among FoFs, and second, the difference in returns between ETF prices and FoF NAVs.
Return divergence among FoFs
FoFs deploy investor money into ETF units within a tightly defined window. Like any mutual fund, FoFs follow a 3 PM cut-off for purchases and redemptions. By around 3:05–3:10 PM, the fund house knows the exact net inflow or outflow for the day. This amount is then used to buy units of the underlying ETF typically between 3:10 PM and 3:30 PM, near market close, at prevailing market prices, not at the ETF’s NAV.
Unlike FoFs (which transact at end-of-day NAV), ETFs trade on the exchange through the day at a market price that can differ from their NAV that are declared post market hours.
If the ETF is trading at a premium or discount to its indicative NAV during this window, the FoF ends up buying units at inflated or deflated prices. This mismatch directly reflects in the FoF’s NAV and creates a return gap versus the ETF. When such premiums or discounts persist — especially during volatile market phases — the cumulative impact becomes meaningful, causing FoF returns to lag or differ from ETF returns.
Further, the FoF’s own NAV calculation adds to the divergence. FoFs compute their NAV based on the ETF’s closing market price, not the ETF’s underlying NAV. As a result, any distortion in the ETF’s closing price feeds directly into the FoF’s NAV.
ETF premiums or discounts arise when market demand and supply push the trading price above or below the ETF’s underlying value. Illiquidity and the lack of active market making also play a role in ETFs. Buying at a premium or selling at a discount can dilute returns, especially during volatile or illiquid market conditions. This applies not only to ETF investors but also to FoFs.
ETFs have market makers/authorised participants that help keep price close to NAV; FoFs don’t trade on exchange and therefore inherit the underlying ETF’s liquidity/price efficiency.
Some fund houses attempt to minimise this effect by following an internal rule: if the ETF’s closing price deviates from its NAV by more than 3 per cent, the FoF uses the ETF’s NAV instead of the market price. However, not all AMCs adopt this practice.
In smaller ETFs with low trading volumes, large trades during the final minutes of the session can temporarily distort prices. In contrast, larger ETFs with deep liquidity and active market making are far less prone to such distortions. Higher volumes keep bid–ask spreads tight and price discovery efficient, reducing the likelihood of FoFs transacting at unfavourable prices.
ETF–FoF return difference
Our back-of-the-envelope analysis shows that, on average, FoFs delivered about 1.4 per cent lower returns than ETFs based on closing prices for one-year returns calculated over the past two years.
Cash drag: Mutual fund schemes tend to maintain cash buffers to manage liquidity, subscriptions, and redemptions. Cash held during a rally generates negligible returns relative to gold or silver and represents an opportunity cost that increases with the strength of the rally. Cash drag is a theoretical channel, but not the main driver in this sample. Interestingly, cash has not been a significant return deterrent for all gold and silver FoFs, as many were nearly fully invested in their respective commodity assets. Over the last one year, the average cash holding of gold FoFs was just 0.8 per cent, while silver FoFs held about 0.2 per cent.
Expense ratio differential: Another factor is the dual-layer expense structure inherent to FoFs. ETFs charge their own Total Expense Ratio (TER), typically ranging between 0.3–0.8 per cent for gold ETFs (as of December 2025) and 0.33–0.58 per cent for silver ETFs. The FoF structure imposes an additional layer of expenses. Gold FoFs charge about 0.35–1 per cent, while silver FoFs charge 0.5–1 per cent on top of the underlying ETF’s expenses. (Regular plans considered.)
Compounding drag: Another factor widening the return gap is reverse compounding. While positive returns compound upward, expenses and premium acquisition costs — resulting in fewer ETF units being bought — also compound on an ever-growing base. For example, if you invest ₹10,000 and the ETF is at ₹100, you get 100 units. If the FoF ends up buying at a 2 per cent premium (₹102), it gets around 98 units. If gold later rises 50 per cent, ETF price is ₹150 and those 98 units are worth ₹14,700 vs ₹15,000 for 100 units. The gap widens as prices rise. In flat markets, this differential may remain small. But in a strong bull run, the same percentage drag erodes significantly more wealth in absolute terms, turning a modest cost difference into a large performance gap.
What should you do?
ETFs are ideal for informed investors with demat accounts who actively monitor market prices, spreads, and liquidity, and seek low-cost, efficient exposure. FoFs suit retail investors who prioritise ease, SIP investing, and operational simplicity, even if that means slightly higher costs and occasional return deviation.
Just as investors prefer ETFs with higher liquidity, larger corpus, lower tracking error, and lower expense ratios, the same discipline should be applied when selecting FoFs. Choosing FoFs built on the most liquid ETFs can help minimise structural return drag and ensure returns stay closer to the underlying metal’s true performance. You can check additional filters too by tracking difference vs the underlying ETF over the last 1 year.
For FoFs, avoid last-minute or knee-jerk buys/sells on days of extreme moves when ETF premiums/discounts can widen and the gap versus fair value can spike.
Among gold FoFs, Nippon India Gold Savings, SBI Gold Fund, and HDFC Gold ETF FoF managed to stay relatively closer to their ETF counterparts and the underlying metal (based on one-year rolling data over the past two years). In silver, Nippon India Silver ETF FoF, HDFC Silver FoF, and UTI Silver ETF FoF appear to be relatively better options.
Published on February 7, 2026