filo
Investment Thesis
The First Trust Multi Cap Value AlphaDEX Fund (NASDAQ:FAB) is a well-established ETF providing investors with exposure to almost 700 U.S. stocks from all size segments selected for their strong value characteristics. It seems like a good single-product solution for value investors, and my fundamental analysis did reveal more strengths than weaknesses compared to low-cost passive ETFs. However, FAB’s 0.64% expense ratio makes me uneasy, as does its quarterly reconstitution schedule, which may have contributed to its mediocre long-term track record. Therefore, I believe a neutral “hold” rating is most appropriate, but it’s an interesting ETF to follow, and I hope you enjoy my review below.
FAB Overview
Strategy Discussion
FAB tracks the Nasdaq AlphaDEX Multi Cap Value Index, selecting stocks from three Nasdaq Indexes representing different size segments, as follows:
- Nasdaq US 500 Large Cap Value Index (187 stocks)
- Nasdaq US 600 Mid Cap Value Index (225 stocks)
- Nasdaq US 700 Small Cap Value Index (262 stocks)
Once you do the math, you’ll see that the number of stocks selected from each size segment is about 37.5% of the selection universe (e.g., 187/500). The result is a “true” multi-cap fund, with large-, mid-, and small-cap stocks receiving target weights of 50%, 30%, and 20%, respectively. This approach contrasts with other “multi-cap” funds like the iShares Core Dividend Growth ETF (DGRO), which is primarily a large-cap fund due to its modified market-cap-weighting scheme.
According to its website, the Index ranks “all eligible stocks on growth factors like 3-, 6-, and 12-month price appreciation, sales to price and one year sales growth, and separately on value factors including book value to price, cash flow to price and return on assets”. Stocks receive growth and value scores; only top-ranked value stocks qualify. Weights are assigned based on rankings within their size segment, and stocks in the top-ranked quintiles receive higher weightings. Lastly, the Index reconstitutes and rebalances quarterly, which is why portfolio turnover rates consistently approach 100%. Per FAB’s annual report, turnover was 85% last year, and that’s also the case for most other AlphaDEX funds in First Trust’s lineup.
High portfolio turnover rates make analyzing ETFs challenging, but investors receive some “active management” benefits even though it’s technically a passive Index fund. The downside is that these frequent reconstitutions mean the strategy can’t play out for long. For example, something as simple as a solid three-month price return might cause FAB to drop a stock even if it still has plenty of potential left, which goes against the usual “buy and hold” mindset most value investors adopt.
Performance Analysis
One of the easiest ways to benchmark FAB’s performance is by comparing its long-term performance against a series of low-cost value funds representing each size segment. I’ve chosen three ETFs that track S&P Dow Jones Indices, assigned the same target weights as FAB (50/30/20), and set the hypothetical portfolio to rebalance quarterly, as follows:
- SPDR S&P 500 Value ETF (SPYV): Large-Cap (50%)
- SPDR S&P 400 Mid Cap Value ETF (MDYV): Mid-Cap (30%)
- SPDR S&P 600 Small Cap Value ETF (SLYV): Small-Cap (20%)
Here are the results from June 2007 through August 9, 2024:
Over the long term, FAB and this benchmark delivered nearly identical returns (7.51% vs. 7.50% annualized), but FAB was more volatile, leading to inferior risk-adjusted returns (Sharpe and Sortino Ratios). Its 57.07% maximum drawdown, which occurred from June 2007 to February 2009, was about 3% worse, but it rebounded with a 48.40% return in 2009. Still, this data indicates the Index provided just enough excess return to cover its fees. FAB has also trailed this benchmark over the last ten years by 1.70% per year (8.23% vs. 9.93%), which might be more relevant for today’s investors. Furthermore, the tracked Index changed in April 2016, though the extent to which this impacted the strategy is unclear.
Readers can view more data at this link, but I want to highlight how the benchmark’s annualized return since June 2007 dipped by only 0.05% per year (7.50% to 7.45%) when I changed the rebalance frequency to annual from quarterly. This suggests that frequent rebalancing is unnecessary, and you can likely mimic FAB’s strategy by holding three value ETFs of your own. This approach would open many doors regarding which ETF you select from each segment, the weights assigned, and the rebalance frequency.
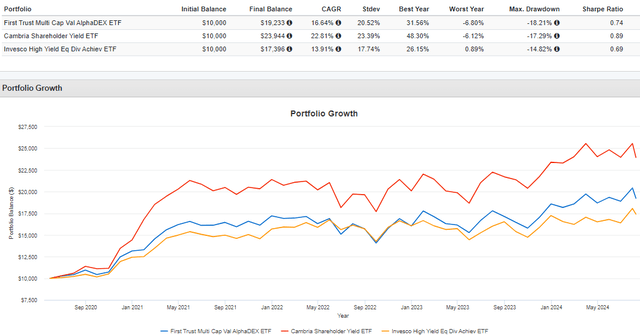
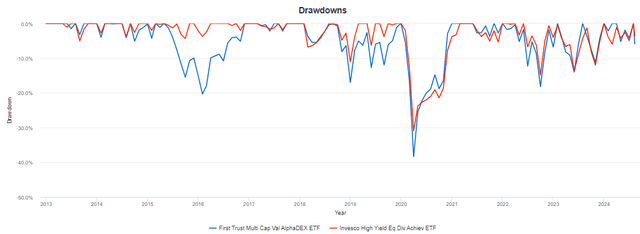
Lastly, consider how FAB has performed against multi-cap funds like the Cambria Shareholder Yield ETF (SYLD) and Invesco High Yield Equity Dividend Achievers ETF (PEY). SYLD switched to an active strategy in June 2020 and has easily outperformed FAB since, while PEY, like most high-dividend funds, has struggled in growth-favored markets but did manage to offer some solid downside protection in 2022.
FAB Fundamental Analysis
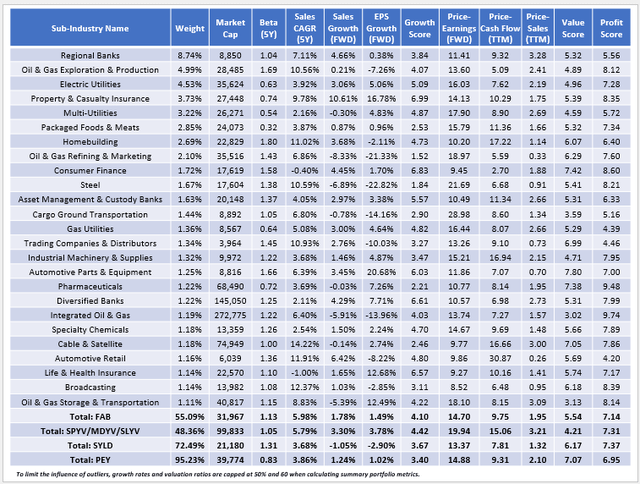
The following table highlights selected fundamental metrics for FAB’s top 25 sub-industries, which total 55% of the portfolio. I chose this approach because FAB only has an 11% concentration in its top 25 holdings, which wouldn’t provide readers with much helpful information.
Here are three observations to consider:
1. FAB’s holdings have a 1.13 weighted average five-year beta, indicating it’s slightly more volatile than the hypothetical benchmark portfolio and consistent with my earlier findings. One reason is that FAB underweights or avoids most mega-cap value stocks like Berkshire Hathaway (BRK.B), Exxon Mobil (XOM), and Johnson & Johnson (JNJ), all of which have betas below one. FAB’s added volatility comes primarily from Oil & Gas Exploration & Production stocks, but it’s still far less volatile than SYLD. E&P stocks account for 11.40% of that ETF compared to 4.99% and 0.00% for the benchmark portfolio and PEY.
2. Compared to the benchmark, FAB has a higher sector-adjusted value score (5.54/10 vs. 4.21/10) but a lower sector-adjusted growth score (4.10/10 vs. 4.42/10), illustrating the tug-of-war that usually plays out with these two factors. As a value-focused fund, I’m pleased that FAB does better on the value factor, but I’m surprised its value score was much worse than SYLD’s and PEY’s 6.17/10 and 7.07/10 scores. You wouldn’t know it by looking at their valuation ratios (e.g., FAB’s 14.70x forward P/E, 11.72x harmonic forward P/E), but it suggests its selections aren’t necessarily optimal. For example, FAB’s Regional Bank stocks have a 5.32/10 value score compared to 6.46/10 for the ones in SYLD. It’s a similar story for Electric Utilities and Multi Utilities, so while these might be cheap sub-industries, FAB hasn’t selected the best valued ones in those sub-industries.
3. The opposite is true for growth. FAB’s 4.10/10 growth score is above SYLD and PEY’s score, and its one-year estimated sales and earnings growth rates are, too. However, the growth rates are virtually flat in all cases, so there’s no doubt these are single-market-environment funds. I doubt FAB is capable of delivering the returns witnessed in 2009, and as support, consider how the July 2009 and January 2010 annual and semi-annual reports noted:
- FAB outperformed during the Great Financial Crisis by underweighting the Financials sector, contributing 10.4% in excess return for the year ending July 31, 2009.
- FAB’s Energy holdings gained 16.5% for the six months ending January 2010, driven by increased economic activity as the GFC ended.
Last week’s disappointing jobs report triggered the Sahm Rule, a relatively new rule that states the economy is in or likely to be in a recession soon when the unemployment rate rises 0.50% above its twelve-month low. It’s not black and white, but its track record is solid, correlating well with recessions (shaded areas) since 1960.
FAB likely won’t benefit in this scenario, as its exposure to Financials stock is about 8% more than in July 2009 (24.26% vs. 16.16%). Furthermore, Energy stocks typically underperform in slowdowns, and FAB’s 11.45% exposure is about 7% more than the benchmark I created. SYLD is most at risk from this high Energy exposure at 21.83%, whereas PEY is well-protected at just 1.40%. This lower risk for PEY is complemented by its 0.83 five-year beta and a solid record of outperforming market downturns since its Index instituted sector and security weight caps in 2013.
Investment Recommendation
FAB is a multi-cap value fund selecting 37.5% of stocks from Nasdaq Indexes representing the small-, mid-, and large-cap segments. Its fundamentals match up well with a hypothetical benchmark I created using three low-cost value funds based on the S&P 1500 Composite Index, but I was disappointed by FAB’s underwhelming recent returns and its 0.64% annual fee. Moreover, peers like SYLD and PEY have better sector-adjusted value scores and could be better choices depending on your bullish or bearish view of the market. Given these strengths and weaknesses, I believe a “hold” rating is most appropriate, but it’s an exciting fund I plan on watching closer, and I hope you found this information helpful. Thank you for reading.


