
")
mapo
FPX Strategy
First Trust US Equity Opportunities ETF (NYSEARCA:FPX) started investing operations in 2006 and tracks the IPOX®-100 U.S. Index. It has 100 holdings, a 30-Day SEC Yield of 0.11% and an expense ratio of 0.59%.
As described in the prospectus by First Trust, the underlying index…
… seeks to measure the performance of equity securities of the 100 typically largest and most liquid initial public offerings (“IPOs”) (including spin-offs and equity carve-outs) of U.S. companies (…) a company is eligible for inclusion in the Index on the close of the 6th trading day following its IPO and is eligible to remain in the Index until the close of the 1,000th trading day.
Eligible securities must meet size and liquidity criteria. The 100 eligible securities with the largest market capitalizations are included in the index and weighted based on market capitalization with a maximum weight of 10%. The index is reconstituted quarterly, and the fund’s turnover rate in the most recent fiscal year was 123%.
FPX Portfolio
The portfolio is invested in US companies, with about 40% of asset value in mid-caps, 30% in large caps and 30% in small caps per Fidelity classification. First Trust uses the Russell 3000 and S&P 500 indexes as a benchmark, which have over 70% in large and mega caps. I find them inappropriate and this article will use as a benchmark the S&P Mid-Cap 400 Index, represented by iShares Core S&P Mid-Cap ETF (IJH), whose size profile is closer to FPX (although it almost ignores large caps -there is no perfect benchmark).
The heaviest sector in the portfolio is industrials (25.4% of asset value), followed by technology (20%), healthcare (18.2%), financials (13.5%) and consumer discretionary (11.4%). Other sectors are below 4%. Compared to the benchmark, FPX significantly overweights technology and healthcare and underweights materials, energy, consumer staples, and financials. It ignores real estate.
FPX sector breakdown (Chart: author; data: Vanguard, iShares)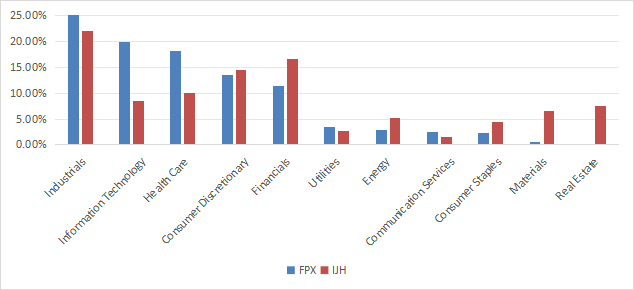
The portfolio is quite concentrated: the top 10 holdings, listed in the next table with fundamental metrics, represent 45.5% of asset value. The top 4 names weigh between 5% and 10%. Risks related to other individual companies are low.
|
Ticker |
Name |
Weight |
EPS growth %TTM |
P/E TTM |
P/E fwd |
Yield% |
|
Regeneron Pharmaceuticals, Inc. |
10.07% |
-0.21 |
28.37 |
23.79 |
0 |
|
|
Carrier Global Corporation |
7.33% |
49.09 |
16.91 |
22.30 |
1.20 |
|
|
Airbnb, Inc. |
5.51% |
149.72 |
16.79 |
27.47 |
0 |
|
|
Samsara Inc. |
5.43% |
-8.09 |
N/A |
266.47 |
0 |
|
|
Otis Worldwide Corporation |
3.62% |
12.88 |
26.07 |
24.23 |
1.67 |
|
|
DoorDash, Inc. |
3.17% |
69.06 |
N/A |
3730.36 |
0 |
|
|
Constellation Energy Corporation |
2.86% |
1545.21 |
22.69 |
21.90 |
0.83 |
|
|
Palantir Technologies Inc. |
2.86% |
775.97 |
138.13 |
73.18 |
0 |
|
|
DraftKings Inc. |
2.38% |
66.25 |
N/A |
N/A |
0 |
|
|
Kenvue Inc. |
2.23% |
-21.83 |
23.37 |
16.01 |
4.51 |
Fundamentals
FPX is more expensive than the benchmark regarding valuation ratios and has a better cash flow growth rate, as reported in the next table.
|
FPX |
IJH |
|
|
P/E TTM |
21.34 |
19.57 |
|
Price/Book |
4.54 |
2.54 |
|
Price/Sales |
3.18 |
1.5 |
|
Price/Cash Flow |
19.6 |
11.81 |
|
Cash flow growth % |
24.15% |
9.69% |
Data Source: Fidelity
In my ETF reviews, I consider risky stocks to be companies with at least 2 red flags among bad Piotroski score, negative ROA, and bad or dubious Altman Z-score (excluding financials and real estate where these metrics are unreliable). With this assumption, risky stocks weigh 14.8% of FPX’s asset value, which is acceptable but not great. Additionally, according to my calculation of aggregate quality metrics (reported in the next table), portfolio quality is inferior to the mid-cap benchmark.
|
FPX |
IJH |
|
|
Atman Z-score* |
6.8 |
3.34 |
|
Piotroski F-score |
5.02 |
5.7 |
|
ROA % TTM |
4.07 |
5.3 |
* above 1.81 is OK, higher is not always better.
Performance
Since its inception, FPX has outperformed the mid-cap benchmark by 65 bps in annualized return. As reported below, it is also slightly more volatile.
|
Total Return |
Annual Return |
Drawdown |
Sharpe ratio |
Volatility |
|
|
FPX |
416.09% |
9.38% |
-56.29% |
0.51 |
19.81% |
|
IJH |
362.59% |
8.73% |
-55.07% |
0.5 |
18.53% |
However, FPX has lagged IJH by almost 6% over the last 12 months:
FPX vs IJH, last 12 months (Seeking Alpha)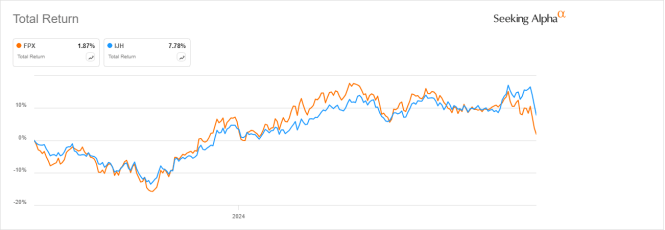
FPX vs. competitors
FPX is classified by Fidelity and Morningstar in the “Mid-Cap Growth” category. The next table compares the characteristics of FPX with another ETF focused on initial public offerings and three mid-cap growth ETFs with different methodologies:
- Renaissance IPO ETF (IPO).
- SPDR S&P 400 Mid Cap Growth ETF (MDYG).
- Vanguard Mid-Cap Growth Index Fund ETF Shares (VOT).
- iShares Morningstar Mid-Cap Growth ETF (IMCG).
|
FPX |
IPO |
MDYG |
VOT |
IMCG |
|
|
Inception |
4/12/2006 |
10/16/2013 |
11/8/2005 |
8/17/2006 |
6/28/2004 |
|
Expense Ratio |
0.59% |
0.60% |
0.15% |
0.07% |
0.06% |
|
AUM |
$642.39M |
$139.99M |
$2.55B |
$24.90B |
$1.91B |
|
Avg Daily Volume |
$1.41M |
$1.64M |
$29.33M |
$33.08M |
$7.07M |
|
Holdings |
100 |
42 |
253 |
154 |
306 |
|
Top 10 |
45.50% |
60.81% |
11.72% |
17.11% |
9.37% |
|
Turnover |
123.00% |
60.00% |
52.00% |
14.00% |
43.00% |
The two IPO-focused ETFs have similar fees, yet FPX is larger, more liquid, and better diversified. The growth funds have cheaper expenses and are much larger.
Based on 10-year total returns, plotted on the next chart, FPX beats IPO but is far behind the growth funds. The best performer is IMCG.
FPX vs competitors, 10-year return (Seeking Alpha)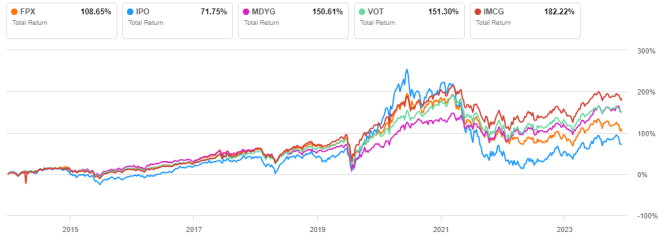
FPX shows the weakest performance of this group over the last 12 months:
FPX vs competitors, 12-month return (Seeking Alpha)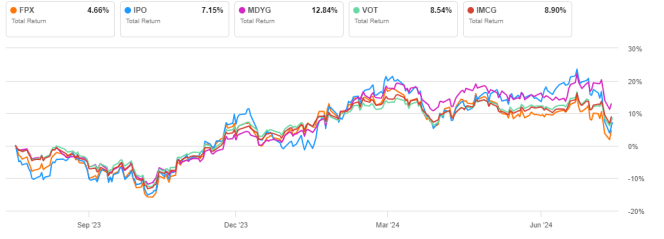
Takeaway
First Trust US Equity Opportunities ETF (FPX) holds 100 stocks in the first 1,000 trading days (about 4 years) after their IPOs. FPX is well diversified across sectors, with a tilt to industrials. Nonetheless, it is quite concentrated in its top holdings. FPX is classified in the “Mid-Cap Growth” category. Over the last decade, FPX has outperformed its closest competitor IPO. However, it lags other mid-cap growth funds by a significant margin and I don’t think it deserves a “buy” rating based on past performance.