

When private equity firms present their track records to investors, the charts often look too good to be true—higher returns with lower volatility than public markets. As it turns out, they often are too good to be true.
The Allure of “Perfect” Returns
Investors considering private equity allocations are frequently presented with compelling performance charts, like from the study “Does the Case for Private Equity Still Hold?,“ showing that adding private equity will improve portfolio efficiency as it has provided higher returns with less volatility than public market equivalents—a seemingly perfect investment proposition.
But there’s a critical issue lurking beneath these smooth return curves: volatility laundering.
What Is Volatility Laundering?
Volatility laundering, a term coined by AQR’s Cliff Asness, describes how private equity funds systematically understate the actual risk in their investments.
The difference lies in how assets are valued.
In public markets, stock prices update continuously throughout trading hours, reflecting every shift in market sentiment, economic news, and investor emotion. This constant price discovery reveals significant volatility: The S&P 500 has exhibited approximately 19% annual volatility since 1926.
Private equity holdings are typically valued only quarterly, and these valuations often rely on models and assumptions rather than real-time market pricing. This infrequent valuation schedule creates an artificial smoothing effect, making returns appear less volatile than they actually are.
The irony is stark: Private equity companies are generally smaller, less diversified, and more leveraged than their public counterparts, characteristics that should increase—not decrease—risk and volatility (particularly if the private equity fund adds its own leverage).
The Academic Evidence
Mark Anson’s 2024 study “Amortizing Volatility Across Private Capital Investments” provides compelling evidence of this phenomenon. Published in The Journal of Portfolio Management, Anson demonstrated how private valuation methods create a smoothing effect that allows managers to “amortize” volatility over time. This smoothing leads to two problematic outcomes:
- Lower systematic risk estimates (beta): Making private equity appear less correlated with market movements, suggesting better diversification benefits than actually exist.
- Inflated alpha estimates: Overstating managers’ skill in generating excess returns.
A More Nuanced View: Real Market Differences
However, there are reasons private markets might exhibit less volatility than public ones.
Public markets are susceptible to emotional investing patterns:
- FOMO-driven bubbles: Fear of missing out can drive valuations well above intrinsic value.
- Panic selling: Loss aversion and margin calls can push prices below fair value during downturns.
- Sentiment swings: Daily price movements can reflect emotion rather than fundamental changes.
Private markets, insulated from these behavioral influences, may genuinely experience more stable valuations.
Consider this comparison of valuation multiples covering the period 2016-25.

The leveraged buyout data is from Ropes & Gray, and the S&P 500 data is from S&P Capital IQ. Note that the table includes two columns for EBITDA multiples because the empirical research finds that EBITDA addbacks to private equity reported data (versus standard GAAP) have averaged about 30%, meaning that private equity sponsors are too aggressive in their EBITDA claims (overstating that figure) and consequently are also aggressive in reporting their purchase price multiples (understating the multiple). To “normalize” the purchase price multiples, the second column adjusts the multiples upward by 30%. This aims to make the information more comparable to the public company information (via S&P).
With that said, it is important to note that an S&P Global study found that US speculative-grade corporate issuers present earnings, debt, and leverage projections in their marketing materials at deal inception that they cannot realize. This is indicated by its study showing median leverage misses of 2.3 turns in year one after deal inception and 2.7 turns in year two. Thus, the S&P 500 EV/EBITDA multiples are likely too aggressive in accounting as well (for example, taking into account earnings income that has not yet been realized and may never be).
In reviewing the table, you can see that the contrast is striking:
- Using the reported data, private equity EBITDA multiples varied from 10 to 11.9, a spread of 19%, with a standard deviation of 0.6. Using the adjusted data, the EBITDA multiples varied from 13.1 to 15.5, a spread of 18%, with a standard deviation of 0.8.
- Public market valuations varied from 11.1 to 17.2, a spread of 55% (3 times as wide), with a standard deviation of 2.2, almost 3 times the 0.8 standard deviation of the adjusted EBITDA multiples of private valuations. Note that this should not be interpreted to mean that private equity is one-third as risky as public equity, but the multiples have been 3 times as volatile.
EBITDA Adjustments Is Not Unique to Private Markets
The differences between reported EBITDA multiples and adjusted multiples are not only well-known by active market participants—private equity buyers and direct lenders scrutinize what figure is used as EBITDA by sellers/issuers—but it is not unique to private markets.
For example, a 2021 analysis by rating agency Fitch of 858 issuers found that 94% of companies assigned a model-based credit opinion using Fitch’s Corporate Credit Opinion Model required an adjustment to reported EBITDA. Fitch will typically adjust EBITDA to remove recurring sponsor and management fees, one-time cost savings, revenue synergies, deferred revenue, and a broad category for other adjustments.
We observe the same differences in valuations (reflecting the illiquidity premium) and valuation volatility that we observed in public versus private equities when we look at the data on private versus public real estate.
Public REITs Versus Private REITs
We can observe real estate valuations and their volatility by examining the dividend yield on REITs (public REITs must pay out virtually all their income) and comparing them with the transaction capitalization rates (net operating income divided by sales price) derived from actual real estate transactions tracked by the National Council of Real Estate Investment Fiduciaries. We can invert the published figures to get the valuation multiples. The table below covers the period from January 2000 to March 2025 and provides the mean multiples, the range of the multiple, and the standard deviation of the multiple.
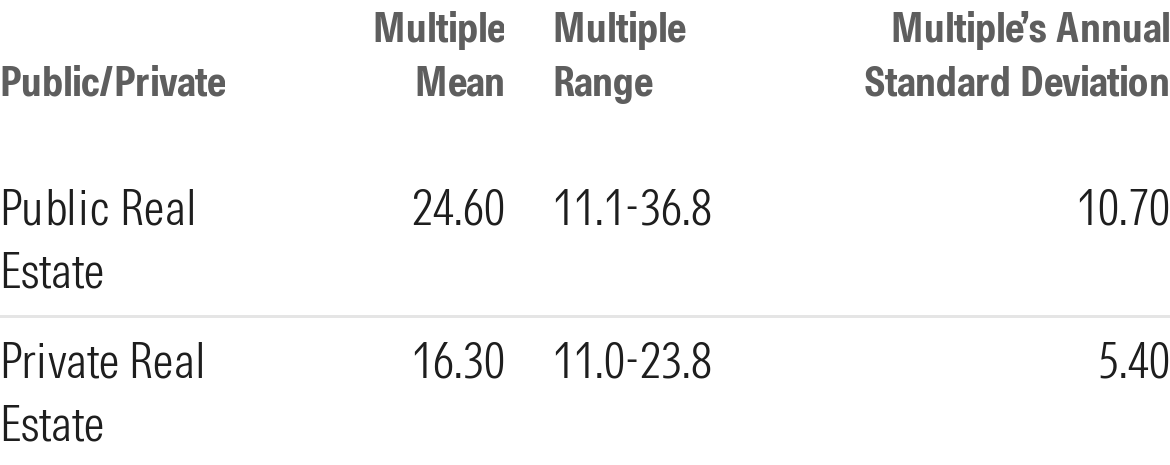
Public REIT multiples averaged about 50% higher than private multiples (reflecting the illiquidity premium). The range in multiples for public REITs was also much wider, and their standard deviation was basically twice as high.
If we calculate the cap spread between private and public REITs, private REITs today have a 1.77% higher cap rate (reflecting the illiquidity premium) than the dividend yield on public REITs. It is also interesting to note that there were two short periods (around 1990 and 2008) when public REITs did have lower valuations (higher expected returns). Recognizing that such dislocations can occur during bear markets (on account of panicked selling by retail investors and forced sales from margin calls), Apollo Diversified Real Estate Interval GRIFX, while targeting a 70% private/30% public allocation, actively manages the fund to attempt to take advantage of such dislocations, which historically have been temporary.
The Investment Reality Check: What This Means for Investors
Volatility laundering is a real phenomenon that private equity promoters often use to make their asset class appear more attractive. This doesn’t necessarily make private equity (or private credit or private real estate) a poor investment choice. However, it does mean investors relying on smoothed return data are likely underestimating their risk exposure (more so in private equity than in private credit).
The truth lies somewhere in the middle. While valuation smoothing artificially reduces reported volatility, genuine structural differences between public and private markets do result in some volatility reduction. The challenge for investors is to distinguish between the two effects.
Addressing the Smoothing Problem
Researchers have attempted to address the smoothing problem. For example, Anson’s 2024 study used lagged betas to unsmooth the return series associated with private capital and found that doing so leads to a lower allocation to private capital in portfolio construction models as volatility increased and correlations to public markets increased (except for private credit, where the increase was negligible). For example, he found that accounting for lagged betas doubled the reported volatility of small buyout funds to 22% from 11%. For large buyout funds, the increase was to 21% from 12%. For early-stage (late-stage) venture capital, the increase was to 87% (38%) from 29% (19%). For real estate, the increase was to 25% from 9%. For secondaries, the increase was to 27% from 9%. However, for private credit there was little impact, with volatility increasing to 9% from 8%.
The amortization of volatility should be of concern for private capital asset classes. To properly budget for beta risks, it is critical that investors in private assets understand the amount of systemic (beta) risk that will “wash” into their private portfolios. Depending on the asset, investors should include estimates of lagged betas to properly account for the systematic risk embedded in private assets. Anson showed that for venture capital, the lagged betas can extend back three to four quarters, and for real estate—the least liquid asset class—the lagged betas can extend up to five quarters. For private credit, the issue should be relatively minor, as Anson found that lagged betas and accounting for Fama-French factors had virtually no effect on the returns to private credit, and alphas were virtually unaffected (assuming one limits investments to higher-quality loans such as senior, secured, and backed by private equity).
Cliffwater Addresses the Lagged Beta Problem
To address the smoothing issue, Cliffwater’s private equity interval fund Cascade Private Capital CPEFX, which prices its holdings daily (including any valuation changes it receives from the primary investor), adjusts valuations of its holdings by applying a “beta adjustment” based on how public prices moved that day. It also applies a daily beta adjustment to its private credit interval fund Cliffwater Corporate Lending CCLFX, to make sure its daily pricing reflects current valuations as much as possible. Cliffwater does so because it recognizes that public market valuations play an important role in determining where private assets trade (for patient trading, not fire sales). Note that while Cliffwater’s methodology is an improvement, it does not fully address the stale pricing issue as discussed in Anson’s paper.
Could There Be A Negative Illiquidity Premium?
AQR’s Asness suggests that investors’ love for smoothed returns may be so strong that demand for private assets subject to this “volatility laundering” could lead private assets to rise in price to the point that they would provide lower—not higher—expected returns.
Certainly, that is at least theoretically possible, as investors who are ignorant of the volatility laundering will prefer private assets with their lower published volatility, and some investors will just “fool themselves” into believing it. To quote Asness, “The preference for illiquid, infrequently priced assets that don’t smash you in the face with their volatility (even though it’s really there) could be rational in the same sense…. If illiquidity is more positive than negative to many investors, it could easily mean paying a higher price and accepting a somewhat lower return to obtain it.”
With AQR’s insights in mind, we can look at a couple of real-world examples.
Broadly Syndicated Loans Versus Private Credit
Investors desiring to allocate to senior, secured, floating-rate debt have two alternatives: broadly syndicated loans, or BSLs, via funds such as Invesco Senior Loan ETF BKLN and SPDR Blackstone Senior Loan ETF SRLN, and private credit via funds such as CCLFX. BKLN and SRLN have the advantage of being daily liquid, while CCLFX (which can be purchased daily) provides only quarterly liquidity redemptions that can be capped at a 5% maximum. The other major difference between the BSL funds (BKLN and SRLN) and CCLFX is that the BSL funds typically invest in very large, syndicated loans made to large companies, while CCLFX typically invests in loans made to midsize companies (typically with at least $50 million in EBITDA). However, there is little to no difference in their historical realized default losses.
Because liquidity is a risk, the reduced liquidity of CCLFX should be expected to result in a higher yield as compensation. That is exactly what happened. Over the period from July 2019 (inception of CCLFX) to July 2025, BKLN returned 4.6% per year, SRLN returned 4.6%, and CCLFX returned 9.7%. Looking at current yields to maturity, we find that BKLN is at 7.8% and CCLFX is at 10%.
CAT Bonds Versus Quota Shares
Investors desiring to allocate to reinsurance investments can choose to buy a daily liquid catastrophic bond fund such as Stone Ridge High Yield Reinsurance Risk Premium SHRIX or Victory Pioneer CAT Bond CBYYX, or they can choose to invest in the interval funds like Stone Ridge Reinsurance Risk Premium SRRIX or Pioneer ILS Interval XILSX. SRRIX and XILSX invest the large majority of their assets in quota shares, which are illiquid investments. If a quota share had the same risk characteristics as a catastrophic bond (same peril, same deductible, and so on), the expected return on the bond would be about 1.5% lower (on average, noting that liquidity premiums are time varying), reflecting its daily liquidity.
Takeaways for Investors
Investors should do the following:
Question smooth returns: If private equity returns look too smooth compared with public markets, they probably are—at least partially owing to measurement effects.Adjust your risk models: Don’t rely solely on historical volatility measures when assessing private equity risk. Consider the underlying business fundamentals, leverage levels, and your need for liquidity.Understand the trade-offs: While private markets may offer some genuine volatility benefits thanks to reduced emotional trading, these benefits are likely significantly smaller than the headline numbers presented by fund sponsors. And as critic Asness has noted, the lower reported volatility might actually help some investors stay more disciplined during bear markets—avoiding panicked selling.Look beyond the marketing: Private equity marketing materials naturally emphasize risk-adjusted returns. Dig deeper into the methodology behind those attractive Sharpe ratios. The volatility laundering debate isn’t about whether private equity is good or bad—it’s about ensuring investors make decisions based on realistic risk assessments rather than artificially smoothed performance metrics.
Larry Swedroe is the author or co-author of 18 books on investing, including his latest Enrich Your Future. He is also a consultant to RIAs as an educator on investment strategies.
Larry Swedroe is a freelance writer. The opinions expressed here are the author’s. Morningstar values diversity of thought and publishes a broad range of viewpoints.