

RyanKing999/iStock via Getty Images
Investment Approach
- Fidelity® Floating Rate High Income Fund is a diversified leveraged-loan strategy focused on investing primarily in loans that banks have made to non-investment-grade companies.
- We apply a core investment approach, with the majority of the fund concentrated in securities rated B and BB – the heart of the leveraged-loan market – and below-benchmark exposure to the more opportunistic, lower-rated (CCC or below) credit tiers.
- In particular, we seek companies with strong balance sheets and collateral coverage, high free cash flow, manageable capital structures and improving credit profiles. In doing so, we take a longer-term investment outlook, with an eye to where we are in the credit cycle.
- We strive to uncover these companies through in-depth fundamental credit analysis, working in concert with Fidelity’s high-income and global research teams, with the goal of achieving competitive risk-adjusted returns over a full credit cycle.
|
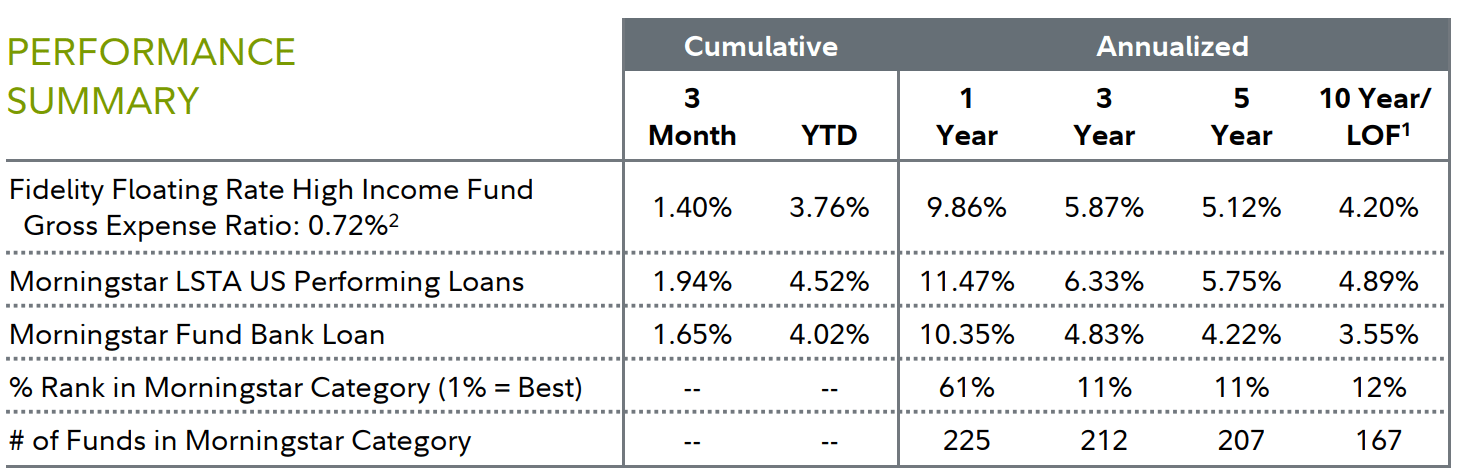
1 Life of Fund (LOF) if performance is less than 10 years. Fund inception date: 08/16/2000. 2 This expense ratio is from the most recent prospectus and generally is based on amounts incurred during the most recent fiscal year, or estimated amounts for the current fiscal year in the case of a newly launched fund. It does not include any fee waivers or reimbursements, which would be reflected in the fund’s net expense ratio. Past performance is no guarantee of future results. Investment return and principal value of an investment will fluctuate; therefore, you may have a gain or loss when you sell your shares. Current performance may be higher or lower than the performance stated. Performance shown is that of the fund’s Retail Class shares (if multiclass). You may own another share class of the fund with a different expense structure and, thus, have different returns. To learn more or to obtain the most recent month-end or other share-class performance, visit Fidelity Funds | Mutual Funds from Fidelity Investments, Financial Professionals | Fidelity Institutional, or Fidelity NetBenefits | Employee Benefits. Total returns are historical and include change in share value and reinvestment of dividends and capital gains, if any. Cumulative total returns are reported as of the period indicated. For definitions and other important information, please see the Definitions and Important Information section of this Fund Review. |
Loan Market Review
Leveraged loans continued to post steady monthly gains in the second quarter of 2024, aided by resilient corporate profits and a generally favorable environment for higher-risk assets.
High-yield bank loans gained 1.94% for the quarter, bringing their year-to-date advance to 4.52%, as measured by the Morningstar LSTA US Performing Loans Index. This was good enough to outpace most other fixed-income categories.
The index rose 0.63% in April. Expectations for continued solid economic growth, along with a growing belief that the U.S. Federal Reserve might keep interest rates higher for longer to combat inflation, boosted loans.
Loans rose 0.96% in May, fueled by a historic repricing/refinancing wave, steady flows into retail funds and the second-most active month of CLO origination on record. In June, loans registered their eighth consecutive monthly gain (+0.32%).
Following a 13.72% advance for the index in 2023, the percentage of loans trading above par (face value) reached as high as 62% in May before receding to 43% by midyear.
Within the index, substantially all industries posted a gain for the three months, with most major groups performing in a fairly tight range. Drugs led all industries, rising 4%. A number of other segments gained about 3%, including food/drug retailers, insurance, utilities, health care, and leisure goods/activities/movies.
Publishing, chemicals & plastics, air transport, and financial intermediaries also topped the benchmark, with each returning roughly 2%.
In contrast, radio & television (-2%) and cable & satellite TV (-1%) were the weakest performers, followed by surface transport, which finished near breakeven.
All telecom, aerospace & defense and home furnishings notably lagged, each returning about 1%.
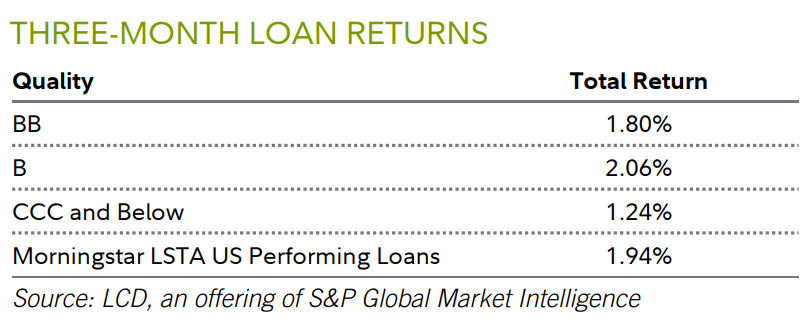
From a credit-rating perspective, loans rated B (+2.06%) fared best, while the BB tier gained 1.80%. Loans rated CCC and below rose 1.24% for the three months.
Looking at supply and demand, issuance of new loans in the second quarter totaled $381.7 billion, versus $65.1 billion for the same period last year. Repricing/refinancing activity accounted for almost all the volume.
On the demand side, loan funds reported $6.6 billion of inflows in the second quarter, compared with outflows of $7.5 billion in the same period last year.
Collateralized loan obligation volume totaled $117.7 billion in the second quarter of 2024, compared with $18.8 billion in Q2 2023. CLOs bundle corporate loans and sell slices of the debt to institutional investors. CLOs represented roughly 60% of loan market assets as of June 30 and constitute an important source of demand.
*1 basis point = 0.01%. (Source: LCD, an offering of S&P Global Market Intelligence, as of 6/30/24. Yield spread is represented by the discounted spread of the Morningstar LSTA US Performing Loans. The average spread is calculated from 3/31/02 through the most recent period.)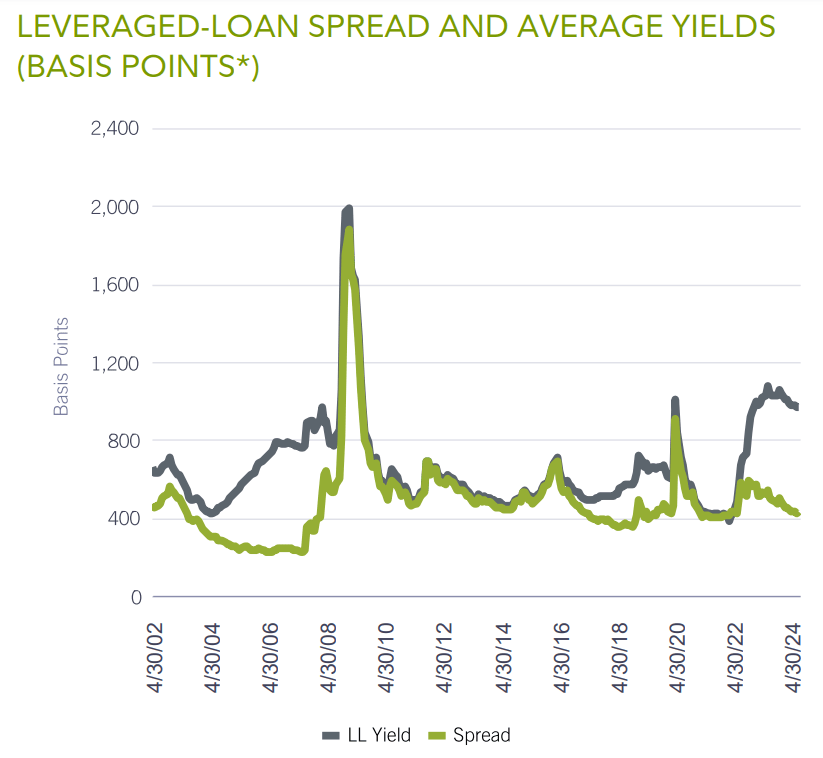
Performance Review
For the quarter, the fund’s Retail Class shares gained 1.40%, lagging the 1.94% advance of the benchmark, the Morningstar LSTA US Performing Loans Index.
The fund’s core bank-loan portfolio, which represented 89% of assets, on average, in Q2, gained 1.74%, slightly trailing the benchmark. The fund’s much smaller stakes in stocks and corporate bonds of loan issuers also lagged the benchmark for the quarter.
An overweight in CSC ServiceWorks (-3%), which provides coin-operated laundry machines, was the largest individual detractor versus the benchmark. The company has experienced a number of management changes, and free cash flow has been disappointing. Additionally, a shift to card-based transactions instead of coins has yet to yield the pricing advantages we anticipated. That said, we continue to believe the company’s business model will lead to stronger results.
A small out-of-benchmark position in chemicals producer Heubach Group (-73%) also detracted. In April, the company announced that it had become insolvent.
A non-benchmark equity stake in energy exploration & production company Chesapeake Energy (CHK) (-7%) was another negative this quarter. The company posted good financial results for the first quarter of 2024 but issued weaker-than-expected guidance for Q2, amid lower natural gas prices.
Conversely, Asurion (+5%) – the fund’s largest position – was the top relative contributor in Q2. The company provides insurance for smartphones, tablets and other consumer electronics. Asurion posted first-quarter earnings that were in line with expectations, and investors cheered the company’s strong free cash flow. After completing an internal investigation into allegations that it breached terms of a client agreement, Asurion announced that it expected the matter to be resolved with no material impact on the company.
Eight of the fund’s top-10 relative contributors were benchmark members we did not own. This group includes companies that are grappling with a large debt load and distressed financials. In our view, helping the fund steer clear of these types of issuer situations is a testament to the skill of our research team.
Outlook and Positioning
Year to date, the combination of high interest rates and a rising stock market created a challenging backdrop for private-equity sponsors, leading to a sharp decline in deal-making, exits and fundraising. Consequently, loan demand far outstripped supply, driving loan prices higher and resulting in a wave of refinancing/ repricing. Repricing activity hampered loan coupons, which caused the yield spread over the base rate to tighten.
Investors became increasingly concerned about the volume of loans scheduled to mature in 2025 and 2026. This refinancing wave has enabled issuers to extend maturities and reduce that risk, which, in turn, should help keep loan default low versus the historical average, in our view. At the same time, refinancing will reduce the income available from new loans because they’re being issued with lower coupons.
Amid the higher-for-longer interest rate environment engineered by the Fed, we remain focused on the ability of companies in the portfolio to cover interest costs and make investments to grow their businesses. To manage the burden of increased interest expense, many loan issuers have cut costs and/or looked for ways to grow revenue faster. We think the companies that are the fund’s highest-conviction holdings are doing a good job with this overall.
Demand for loans continued to be robust as of June 30. Given where short-term interest rates are at midyear, along with the yield spread over the base rate, we think loans look attractive compared to many other investment alternatives.
We will continue to invest for the long term in issuers that we believe have favorable fundamentals, positive and sustainable free cash flow trends, and a strong management team.
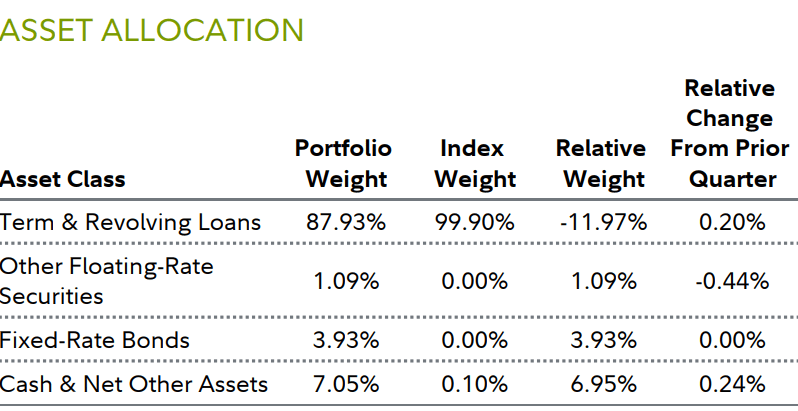
Exposure to loans held steady this quarter, and represented 89% of the portfolio as of June 30. The fund’s minimal allocation to equities was essentially unchanged from the beginning of the quarter. The fund does not actively buy stocks, but may acquire equities as part of bankruptcy filings and restructurings. Our cash allocation slightly increased the past three months, to 4%. This is below the low end of our target range of 5% to 7%, reflecting our active approach to new deals coming to market.
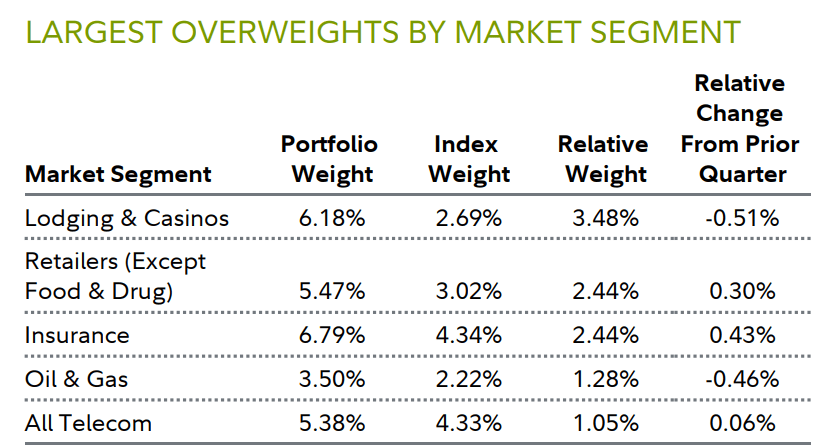
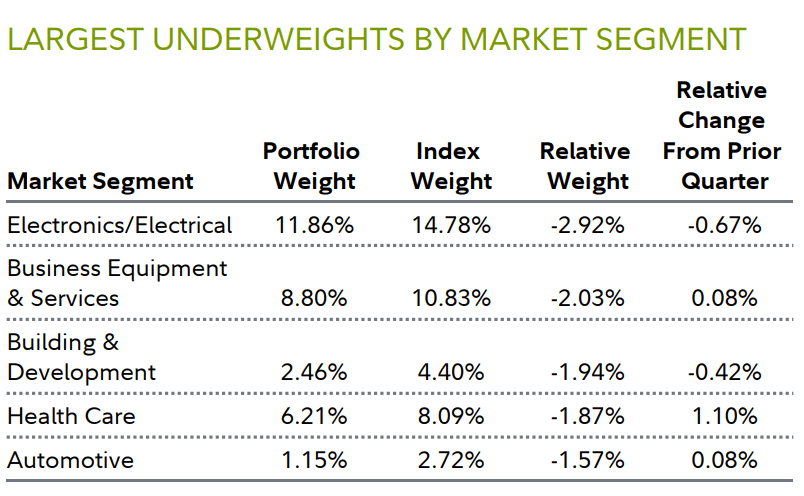
As of June 30, the largest industry overweights were in lodging & casinos, retailers (except food & drug), and insurance. Underweights were most pronounced in electronics/electrical, business equipment & services, and building & development.
| Net Other Assets can include fund receivables, fund payables, and offsets to other derivative positions, as well as certain assets that do not fall into any of the portfolio composition categories. Depending on the extent to which the fund invests in derivatives and the number of positions that are held for future settlement, Net Other Assets can be a negative number. |
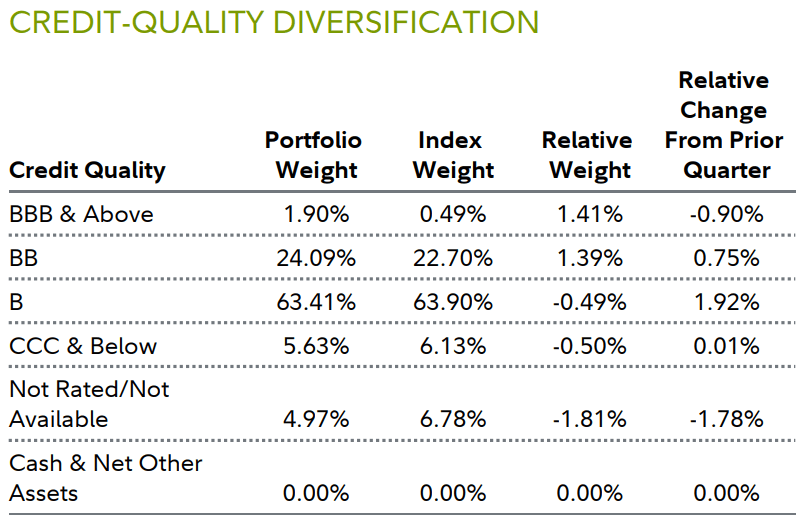
|
Net Other Assets can include fund receivables, fund payables, and offsets to other derivative positions, as well as certain assets that do not fall into any of the portfolio composition categories. Depending on the extent to which the fund invests in derivatives and the number of positions that are held for future settlement, Net Other Assets can be a negative number. Credit ratings for a rated issuer or security are categorized using Moody’ s Investors Service (Moody’s). If Moody’s does not publish a rating for a security or issuer, then the Standard & Poor’s Ratings Services (S&P) rating is used. When S&P and Moody’s provide different ratings for the same issuer or security, the Moody’s rating is used. Securities that are not rated by these NRSROs (e.g. equity securities) are categorized as Not Rated. All U.S. government securities are included in the U.S. Government category. The table information is based on the combined investments of the fund and its pro-rata share of any investments in other Fidelity funds. |
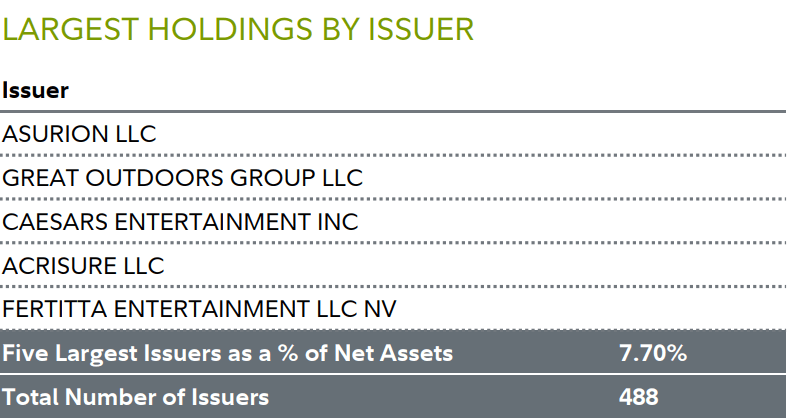
| The five largest issuers are as of the end of the reporting period, and may not be representative of the fund’s current or future investments. Holdings do not include money market investments. |
|
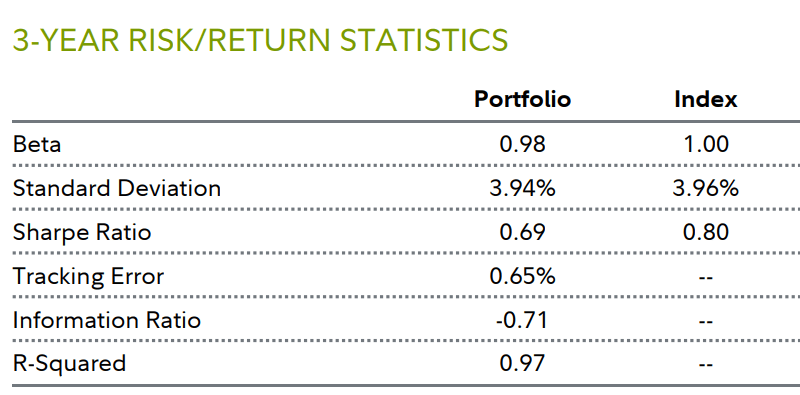
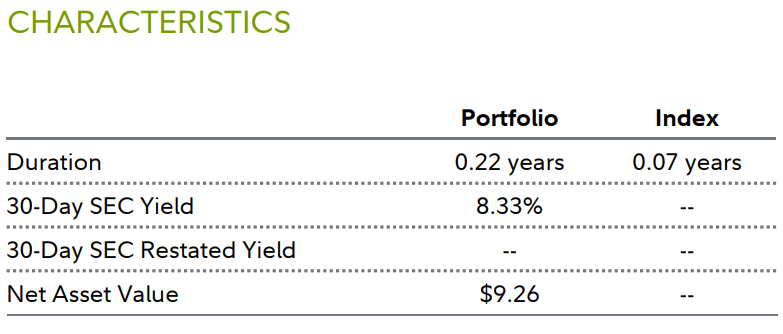
Fund Information Manager(s): Team Managed Trading Symbol: FFRHX Start Date: August 16, 2000 Size (in millions): $14,540.20 Morningstar Category: Fund Bank Loan Lower-quality bonds can be more volatile and have greater risk of default than higher-quality bonds. Floating rate loans may not be fully collateralized and therefore may decline significantly in value. Fixed income investments entail interest rate risk (as interest rates rise bond prices usually fall), the risk of issuer default, issuer credit risk and inflation risk. Foreign securities are subject to interest rate, currency exchange rate, economic, and political risks. Definitions and Important Information Information provided in, and presentation of, this document are for informational and educational purposes only and are not a recommendation to take any particular action, or any action at all, nor an offer or solicitation to buy or sell any securities or services presented. It is not investment advice. Fidelity does not provide legal or tax advice. Before making any investment decisions, you should consult with your own professional advisers and take into account all of the particular facts and circumstances of your individual situation. Fidelity and its representatives may have a conflict of interest in the products or services mentioned in these materials because they have a financial interest in them, and receive compensation, directly or indirectly, in connection with the management, distribution, and/or servicing of these products or services, including Fidelity funds, certain third-party funds and products, and certain investment services. Characteristics Duration is a measure of a security’s price sensitivity to changes in interest rates. Duration differs from maturity in that it considers a security’s interest payments in addition to the amount of time until the security reaches maturity, and also takes into account certain maturity shortening features (e.g., demand features, interest rate resets, and call options) when applicable. Securities with longer durations generally tend to be more sensitive to interest rate changes than securities with shorter durations. A fund with a longer average duration generally can be expected to be more sensitive to interest rate changes than a fund with a shorter average duration. 30-day SEC Yield is a standard yield calculation developed by the Securities and Exchange Commission for bond funds. The yield is calculated by dividing the net investment income per share earned during the 30-day period by the maximum offering price per share on the last day of the period. The yield figure reflects the dividends and interest earned during the 30-day period, after the deduction of the fund’s expenses. It is sometimes referred to as “SEC 30-Day Yield” or “standardized yield”. 30-Day SEC Restated Yield is the fund’s 30-day yield without applicable waivers or reimbursements, stated as of month-end. Net Asset Value is the dollar value of one share of a fund; determined by taking the total assets of a fund, subtracting the total liabilities, and dividing by the total number of shares outstanding. Important Fund Information Relative positioning data presented in this commentary is based on the fund’s primary benchmark (index) unless a secondary benchmark is provided to assess performance. Indices It is not possible to invest directly in an index. All indices represented are unmanaged. All indices include reinvestment of dividends and interest income unless otherwise noted. Morningstar LSTA US Performing Loans is a market-value-weighted index designed to represent the performance of U.S. dollar-denominated institutional leveraged performing loan portfolios (excluding loans in payment default) using current market weightings, spreads and interest payments. Market-Segment Weights Market-segment weights illustrate examples of sectors or industries in which the fund may invest, and may not be representative of the fund’s current or future investments. They should not be construed or used as a recommendation for any sector or industry. Ranking Information © 2024 Morningstar, Inc. All rights reserved. The Morningstar information contained herein: (1) is proprietary to Morningstar and/or its content providers; (2) may not be copied or redistributed; and (3) is not warranted to be accurate, complete or timely. Neither Morningstar nor its content providers are responsible for any damages or losses arising from any use of this information. Fidelity does not review the Morningstar data and, for mutual fund performance, you should check the fund’s current prospectus for the most up-to-date information concerning applicable loads, fees and expenses. % Rank in Morningstar Category is the fund’s total-return percentile rank relative to all funds that have the same Morningstar Category. The highest (or most favorable) percentile rank is 1 and the lowest (or least favorable) percentile rank is 100. The top-performing fund in a category will always receive a rank of 1%. % Rank in Morningstar Category is based on total returns which include reinvested dividends and capital gains, if any, and exclude sales charges. Multiple share classes of a fund have a common portfolio but impose different expense structures. Relative Weights Relative weights represents the % of fund assets in a particular market segment, asset class or credit quality relative to the benchmark. A positive number represents an overweight, and a negative number is an underweight. The fund’s benchmark is listed immediately under the fund name in the Performance Summary. 3-Year Risk/Return Statistics Beta is a measure of the volatility of a fund relative to its benchmark index. A beta greater (less) than 1 is more (less) volatile than the index. Information Ratio measures a fund’s active return (fund’s average monthly return minus the benchmark’s average monthly return) in relation to the volatility of its active returns. R-Squared measures how a fund’s performance correlates with a benchmark index’s performance and shows what portion of it can be explained by the performance of the overall market/index. R-Squared ranges from 0, meaning no correlation, to 1, meaning perfect correlation. An R-Squared value of less than 0.5 indicates that annualized alpha and beta are not reliable performance statistics. Sharpe Ratio is a measure of historical risk-adjusted performance. It is calculated by dividing the fund’s excess returns (the fund’s average annual return for the period minus the 3-month “risk free” return rate) and dividing it by the standard deviation of the fund’s returns. The higher the ratio, the better the fund’s return per unit of risk. The three month “risk free” rate used is the 90-day Treasury Bill rate. Standard Deviation is a statistical measurement of the dispersion of a fund’s return over a specified time period. Fidelity calculates standard deviations by comparing a fund’s monthly returns to its average monthly return over a 36-month period, and then annualizes the number. Investors may examine historical standard deviation in conjunction with historical returns to decide whether a fund’s volatility would have been acceptable given the returns it would have produced. A higher standard deviation indicates a wider dispersion of past returns and thus greater historical volatility. Standard deviation does not indicate how the fund actually performed, but merely indicates the volatility of its returns over time. Tracking Error is the divergence between the price behavior of a position or a portfolio and the price behavior of a benchmark, creating an unexpected profit or loss. Before investing in any mutual fund, please carefully consider the investment objectives, risks, charges, and expenses. For this and other information, call or write Fidelity for a free prospectus or, if available, a summary prospectus. Read it carefully before you invest. Past performance is no guarantee of future results. Views expressed are through the end of the period stated and do not necessarily represent the views of Fidelity. Views are subject to change at any time based upon market or other conditions and Fidelity disclaims any responsibility to update such views. These views may not be relied on as investment advice and, because investment decisions for a Fidelity fund are based on numerous factors, may not be relied on as an indication of trading intent on behalf of any Fidelity fund. The securities mentioned are not necessarily holdings invested in by the portfolio manager(s) or FMR LLC. References to specific company securities should not be construed as recommendations or investment advice. Diversification does not ensure a profit or guarantee against a loss. S&P 500 is a registered service mark of Standard & Poor’s Financial Services LLC. Other third-party marks appearing herein are the property of their respective owners. All other marks appearing herein are registered or unregistered trademarks or service marks of FMR LLC or an affiliated company. Fidelity Brokerage Services LLC, Member NYSE, SIPC, 900 Salem Street, Smithfield, RI 02917. Fidelity Distributors Company LLC, 500 Salem Street, Smithfield, RI 02917. © 2024 FMR LLC. All rights reserved. Not NCUA or NCUSIF insured. May lose value. No credit union guarantee. 657677.46.0 |
Editor’s Note: The summary bullets for this article were chosen by Seeking Alpha editors.