Olena_T
As a thematic approach to investing, ‘growth’ has been dominating the market landscape for a prolonged period. On the back of the AI wave rode the giants of the IT, Communications, and Consumer Cyclical sectors. Is that growth phase now coming to an end? One look at price charts over the past month might tell you that it has, but my thesis here will attempt to show that growth is not dead, and although risk levels might rise exponentially, the companies that led the rally over the past year and a half are still going to show market-beating results over the next year and a half, and quite possibly well beyond.
The vehicle that I’ll use to argue this thesis is Vanguard S&P 500 Growth Index Fund ETF Shares (NYSEARCA:VOOG). However, to offset a significant portion of the expected risk and volatility from the geopolitical and market uncertainty that I think we’re certain to face over the next 12 to 18 months, I will propose a balanced approach that also involves a sister fund, Vanguard S&P 500 Value Index Fund ETF Shares (NYSEARCA:VOOV). That’s the ‘value’ side of Vanguard’s index fund ETFs. Together, I believe they can play a crucial role in boosting your returns as well as safeguarding them in the event that the growth-value cycle inverts again, as I believe it eventually will.
Making Sense of the Cyclical Nature of Growth Vs Value
One of the most interesting phenomena observable in the world of investing is the cyclical and almost deceptively predictable shifts between growth stocks and value stocks. As the names imply, the former comprises shares of companies with high top and bottom line growth rates, strong cash flows, increasing market share, and a resulting increase in valuations. The latter group, on the other hand, usually waits in the wings while growth stocks are on-stage, biding its time, ever-ready to step into the spotlight when its stronger sibling starts to show signs of fatigue.
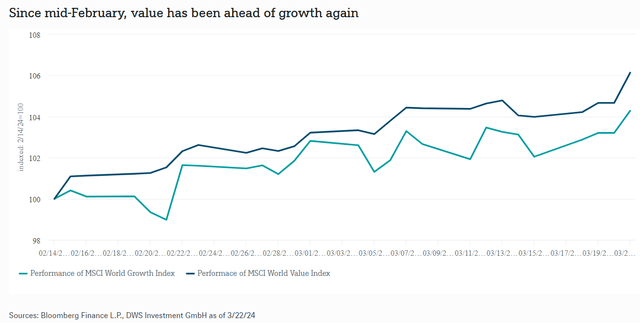
Oddly enough, this isn’t something you can spot on long timeframes. However, if you zoom into shorter and more specific date ranges, you’ll see this cyclicality much more clearly. For example, if you look at this chart from DWS below that tracked growth and value indexes from mid-February to about the end of March 2024, you’ll see a period where value outperformed growth by a significant spread.
This sentiment was clearly mirrored in the U.S. domestic market, where VOOV outperformed VOOG as well as (SP500) over that same time period – mid-February to around the end of March 2024.
If you go to specific time periods in the past, you’ll see the same pattern emerging again and again. Even in periods such as 2022 when the broad market declined, you’ll see VOOV stepping into that spotlight and standing resiliently against the downturn.
Closer to the present time, it becomes amply clear that when the market grows cautious on growth, value steps in to save the day. Look at what’s happened since the June CPI report came out on July 11. Although investors were generally positive on falling inflation, it wasn’t enough to prevent a sell-off in the broader market, which obviously hurt growth stocks but allowed value stocks to stand strong and even show a positive return, in contrast to the overall market and growth stocks.
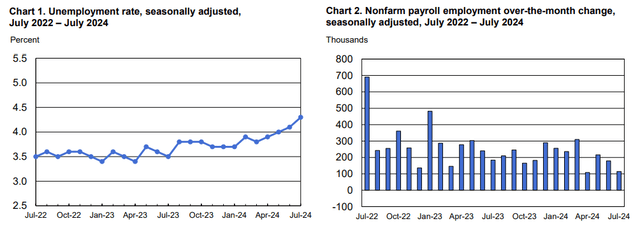
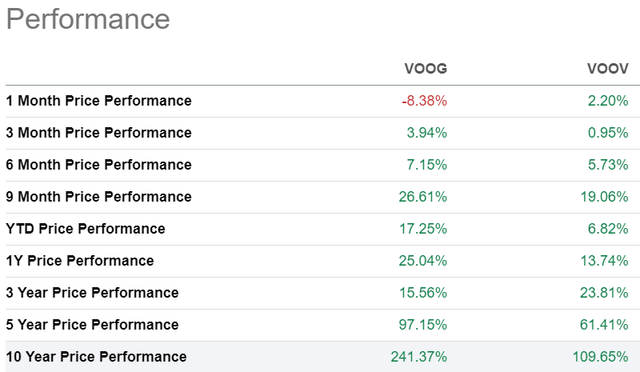
Following the July decline, the August 2 unemployment and nonfarm employment report from the BLS (graph below) only served to worsen the situation for growth stocks, and as I write this, VOOG is down more than 8%, while VOOV is up over 2%, with the broader market falling in between (graph above.)
Now, the question is, are there any indicators that growth is showing signs of fatigue or weakness and value is ready to take center stage? I believe we’ve already seen a couple of secondary ‘triggers’ that can spook investors when market volatility is already relatively high, as we saw through last month.
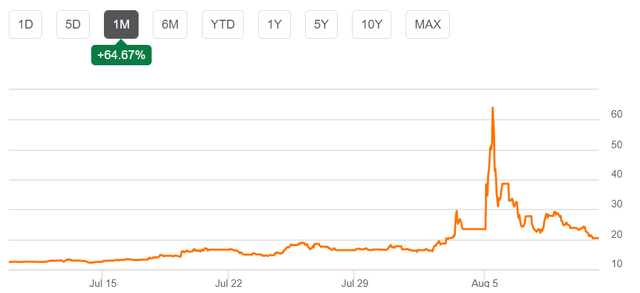
However, the tipping point seems to be August 5 – this past Monday when the entire market lost significant ground. It did show signs of a quick recovery, but not completely. As you can see below, volatility spiked on the day, and is yet to come back down to below 20 on the S&P VIX Index (VIX).
Indicators of Cyclic Shifts from Growth to Value
So, what are these indicators that can tell us when the market is ready to rotate from growth to value?
There are essentially two main indicators of this cyclical shift: one is the spread between valuations of growth stocks and those of value stocks; the second is a gradual shift in sectoral performance. I’ll elaborate on both.
Indicator #1: Valuation Spread
Valuation spreads, in this context, are essentially the difference between aggregate valuation multiples of growth stocks vs value stocks. Here’s an interesting chart from VALIDEA that visualizes this nicely.
VALIDEA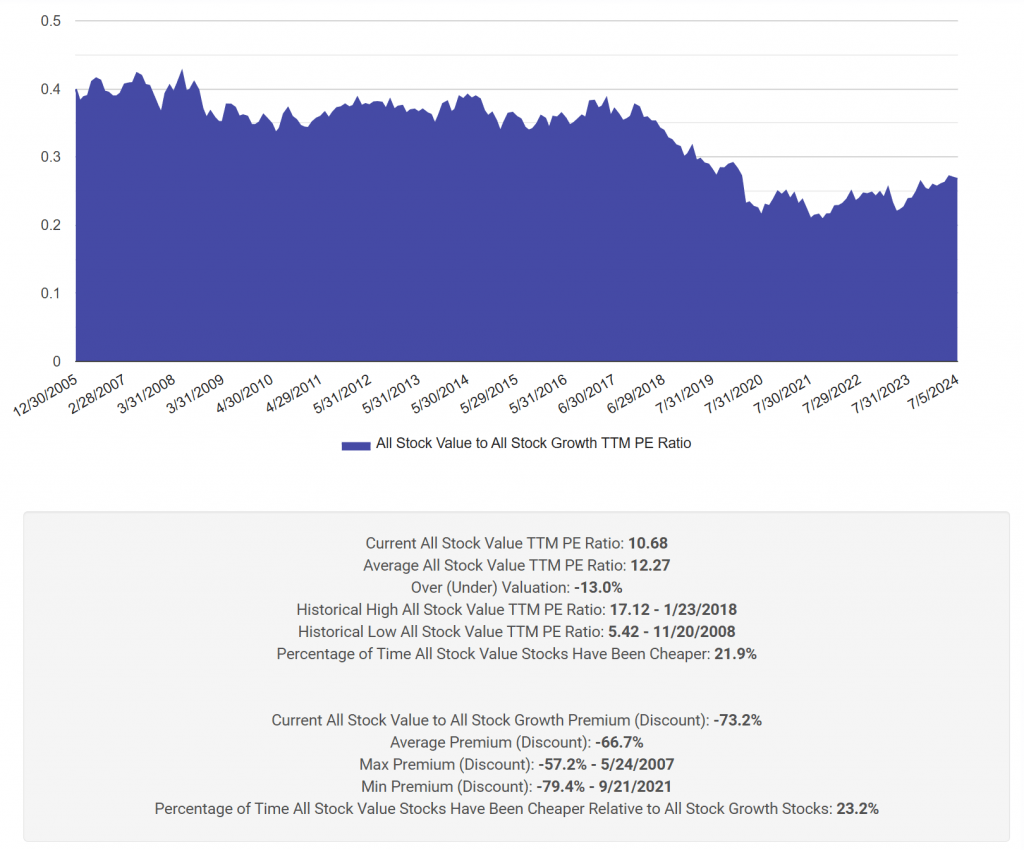
The key takeaways from the above graph and accompanying data points are that, a) on average, value stocks are trading at a 73% discount to growth stocks (against a period average of -67%), and that b) they’ve only been cheaper than this for 23% of the time period under consideration, which goes back as far as 2005. The spread was widest in September 2021, when value was at a 79% discount to growth, and current levels are barely any better.
One important trend to note is that, although that spread has been narrowing for the past year, value stocks are still relatively very cheap compared to growth stocks. If you take the Magnificent 7 as being representative of growth stocks, you’ll see how their stock prices – and, hence, their valuations – have literally run away, far ahead of the rest of the market. That’s one of the key leading indicators that the time is ripe for value stocks to shine.
Crew Wealth Management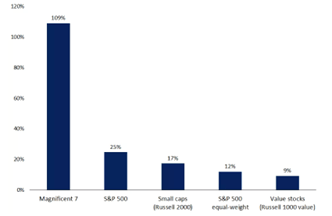
Indicator #2: Sectoral Performance
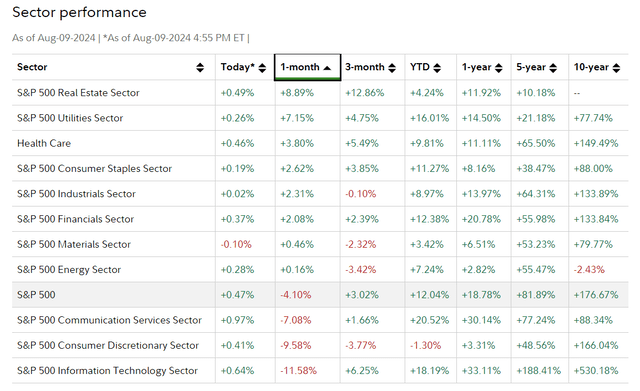
This one is more of a lagging indicator, but it does show early signs of sectoral shifts. Keep in mind that the Magnificent 7, which have largely been responsible for the valuation spread over the past year and a half, primarily belong to three sectors – IT, communications, and consumer discretionary. From that perspective, look at how these sectors have performed against the others. I’ve sorted this by 1M performance (descending) to show those early signs I’m referring to:
As you can see, the Mag 7 sectors were the worst-performing ones over the past month, while the more defensive (read ‘value’) sectors are now emerging as strong performers; in particular, utilities, health care, and consumer staples. As sectors, their valuations have been depressed ever since the Mag 7 took center stage at the end of 2022 and early 2023. That reversal is clearly visible now, over the past 30 days, and if you look at the 3M performance, you’ll see that there were already signs that investors had started rotating into many of these sectors.
When you look at VOOV’s holdings, you’ll see over 60% of its assets invested in those emerging sectors, which is why this ETF is the perfect foil to VOOG. Now comes the twist. What if growth continues to perform better than value over the next six months to a year? And that risk scenario essentially forms my thesis for a VOOG-VOOV pairing.
A Unique Dynamic forms the Perfect Backdrop for a VOOG-VOOV Pairing
The twist to this thesis is that while I do see VOOV as a hedge-like holding to offset the more aggressive VOOG, it’s very likely that growth stocks will continue to outperform value stocks for the foreseeable future. The reason I say this is because even though we’re seeing early signs that value might outperform growth in the coming days, a couple of key catalysts don’t yet seem to be in place – a low interest rate environment and a point of equilibrium for the rowdy AI wave that’s sweeping the investment and market landscape.
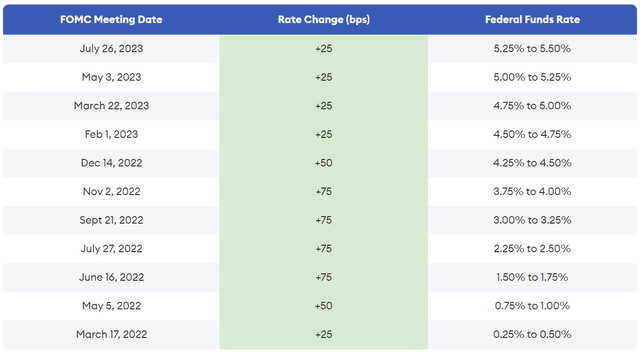
The Fed’s decision to keep interest rates at decade highs for a prolonged period (over a year) has been one of the reasons why mega-caps were able to grow so much faster than smaller companies. Erstwhile defensive industries like general retail and education were seeing costs of capital between 8.5% and 9% at the start of 2024, when just four years ago during the ZIRP era, they were in the 6.5% to 7% range. The high cost of debt made it prohibitive for mid- and small-cap companies to seek debt capital, and with cost of equity being relatively high for some of these value or defensive sectors, their WACCs were literally out of whack!
On top of that fertile economic environment, the biggest tech companies that were already valued near, at, or above the trillion-dollar market cap level were heavily investing in the AI wave and posting strong growth. The market simply didn’t have the time for other industries or sectors because investors were making money hand over fist from just a few of the most in-demand equities.
Then, something happened.
The jolt that the market received earlier this week and the fact that significant market value was wiped out from these giants of tech, communications, and consumer discretionary, along with a poor jobs report and weak PMI print for last month, seem to have collectively tipped things in favor of value stocks. However, neither interest rates nor the AI wave seem to be subsiding. The Fed may cut interest rates because of pressure from the markets, but it has bigger things to deal with, such as the very real possibility of a recession, and inflation that might once again spiral out of control if the cuts are too aggressive.
It doesn’t help that the AI wave is still extremely strong, and in my opinion, we’re not going to see any reduction in AI spending for the foreseeable future. There are a couple of reasons for this, but the main one is that the ‘AI enablers’ – the Amazons, the Microsofts, the Nvidias, the Metas, and the Alphabets of this world – that are spending in the multiple billions toward developing the cloud infrastructure to run AI workloads are already starting to see returns on their early investments. Moreover, these companies continue to sit on cash that’s generating billions in interest income, and besides, they’re spending on the picks and shovels portion of the AI narrative that offers more immediate returns than elaborate AI projects that might or might not pan out. Just the expenditure on infrastructure for cloud compute and networking capacity alone grew 37% YoY to $33 billion, as quoted by DataCenterDynamics from a recent IDC report – and that’s just in Q1 2024!
Other companies – their customers, to be specific – haven’t yet been able to establish stable revenue streams, but I believe they’ll keep digging for gold because these companies now have sunk costs on AI initiatives that they can’t easily back out of.
Gartner, July 2024
Most have invested in projects that have heavy upfront and recurring costs that they can’t roll back once they’ve pulled the trigger on them. Distinguished VP Analyst Rita Sallam at Gartner recently spoke at a Summit in Sydney, Australia, at the end of last month, and this is what she had to say:
After last year’s hype, executives are impatient to see returns on GenAI investments, yet organizations are struggling to prove and realize value. As the scope of initiatives widen, the financial burden of developing and deploying GenAI models is increasingly felt.
Coming back to our case for VOOG and VOOV, I believe growth will continue to reign supreme over value at the higher end of the market cap scale, but as we approach the small-cap, mid-cap, and even large-cap categories in other sectors, we’re going to see value stocks grow stronger even as growth stocks continue their dominance over the broader market.
A Strategy Suggestion
That’s why I suggest adding both VOOG and VOOV to your portfolio. In fact, I’d even go so far as to suggest liquidating all your broad-market, cap-weighted holdings and rotate the funds into these two ETFs. However, the strategy I recommend is to start with a higher allocation to growth, and eventually move closer to an equal weighting, while being prepared to rotate heavily into value should the opportunity arise.
As an example, you might start with a 70-30 VOOG-VOOV ratio to take advantage of any renewed momentum that growth stocks might show over the short to medium term, but as you note weaknesses in growth stocks’ momentum, slowly redistribute that into a 60-40 or 50-50. All the while, keeping the option open to going heavily into value with a 30-70 VOOG-VOOV split.
Going by what’s happened in the past year and a half and just in the last one month alone, and looking at an extremely uncertain future for both the U.S. economy and its equity markets, I’d say this was one of the safer ways to invest in equities.
As for the ETFs themselves, they’re both equally affordable with expense ratios of 0.10% – among the lowest in their respective peer groups. VOOG has an AUM of around $12 billion and ample liquidity (+50 million daily on a 3M average basis), and while VOOG is much smaller at $5.3 billion, its near-$17 million daily dollar volume average should allow you to enter and exit fairly large positions without difficulty.
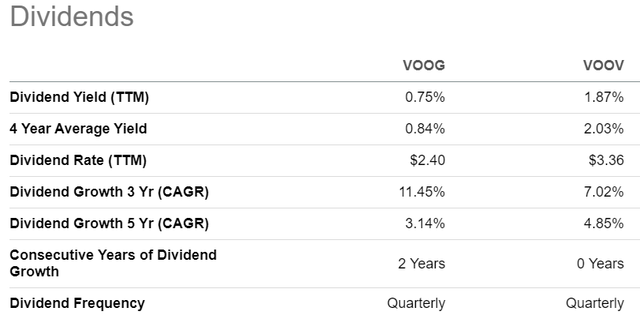
VOOV has a better distribution with a 4-year average yield of 2%, while VOOG has been growing its dividends over the past two years and now yields only 0.75%, but it comes with a 3Y CAGR of nearly 11.5%.
Finally, from a momentum perspective, we see a spread that’s definitely to be expected because the greater part of the last decade and a half have seen near-zero interest rates. That means growth has dominated value for the bulk of that period, which shouldn’t be surprising. The thesis here is that this dynamic will eventually reverse, but may be delayed due to the AI narrative and the chance that interest rates won’t drop as aggressively as they need to. That means it’s best to be prepared for any potential cyclical shift from growth to value.
Thank you for reading my work, and I welcome any comments that would help me do better.

