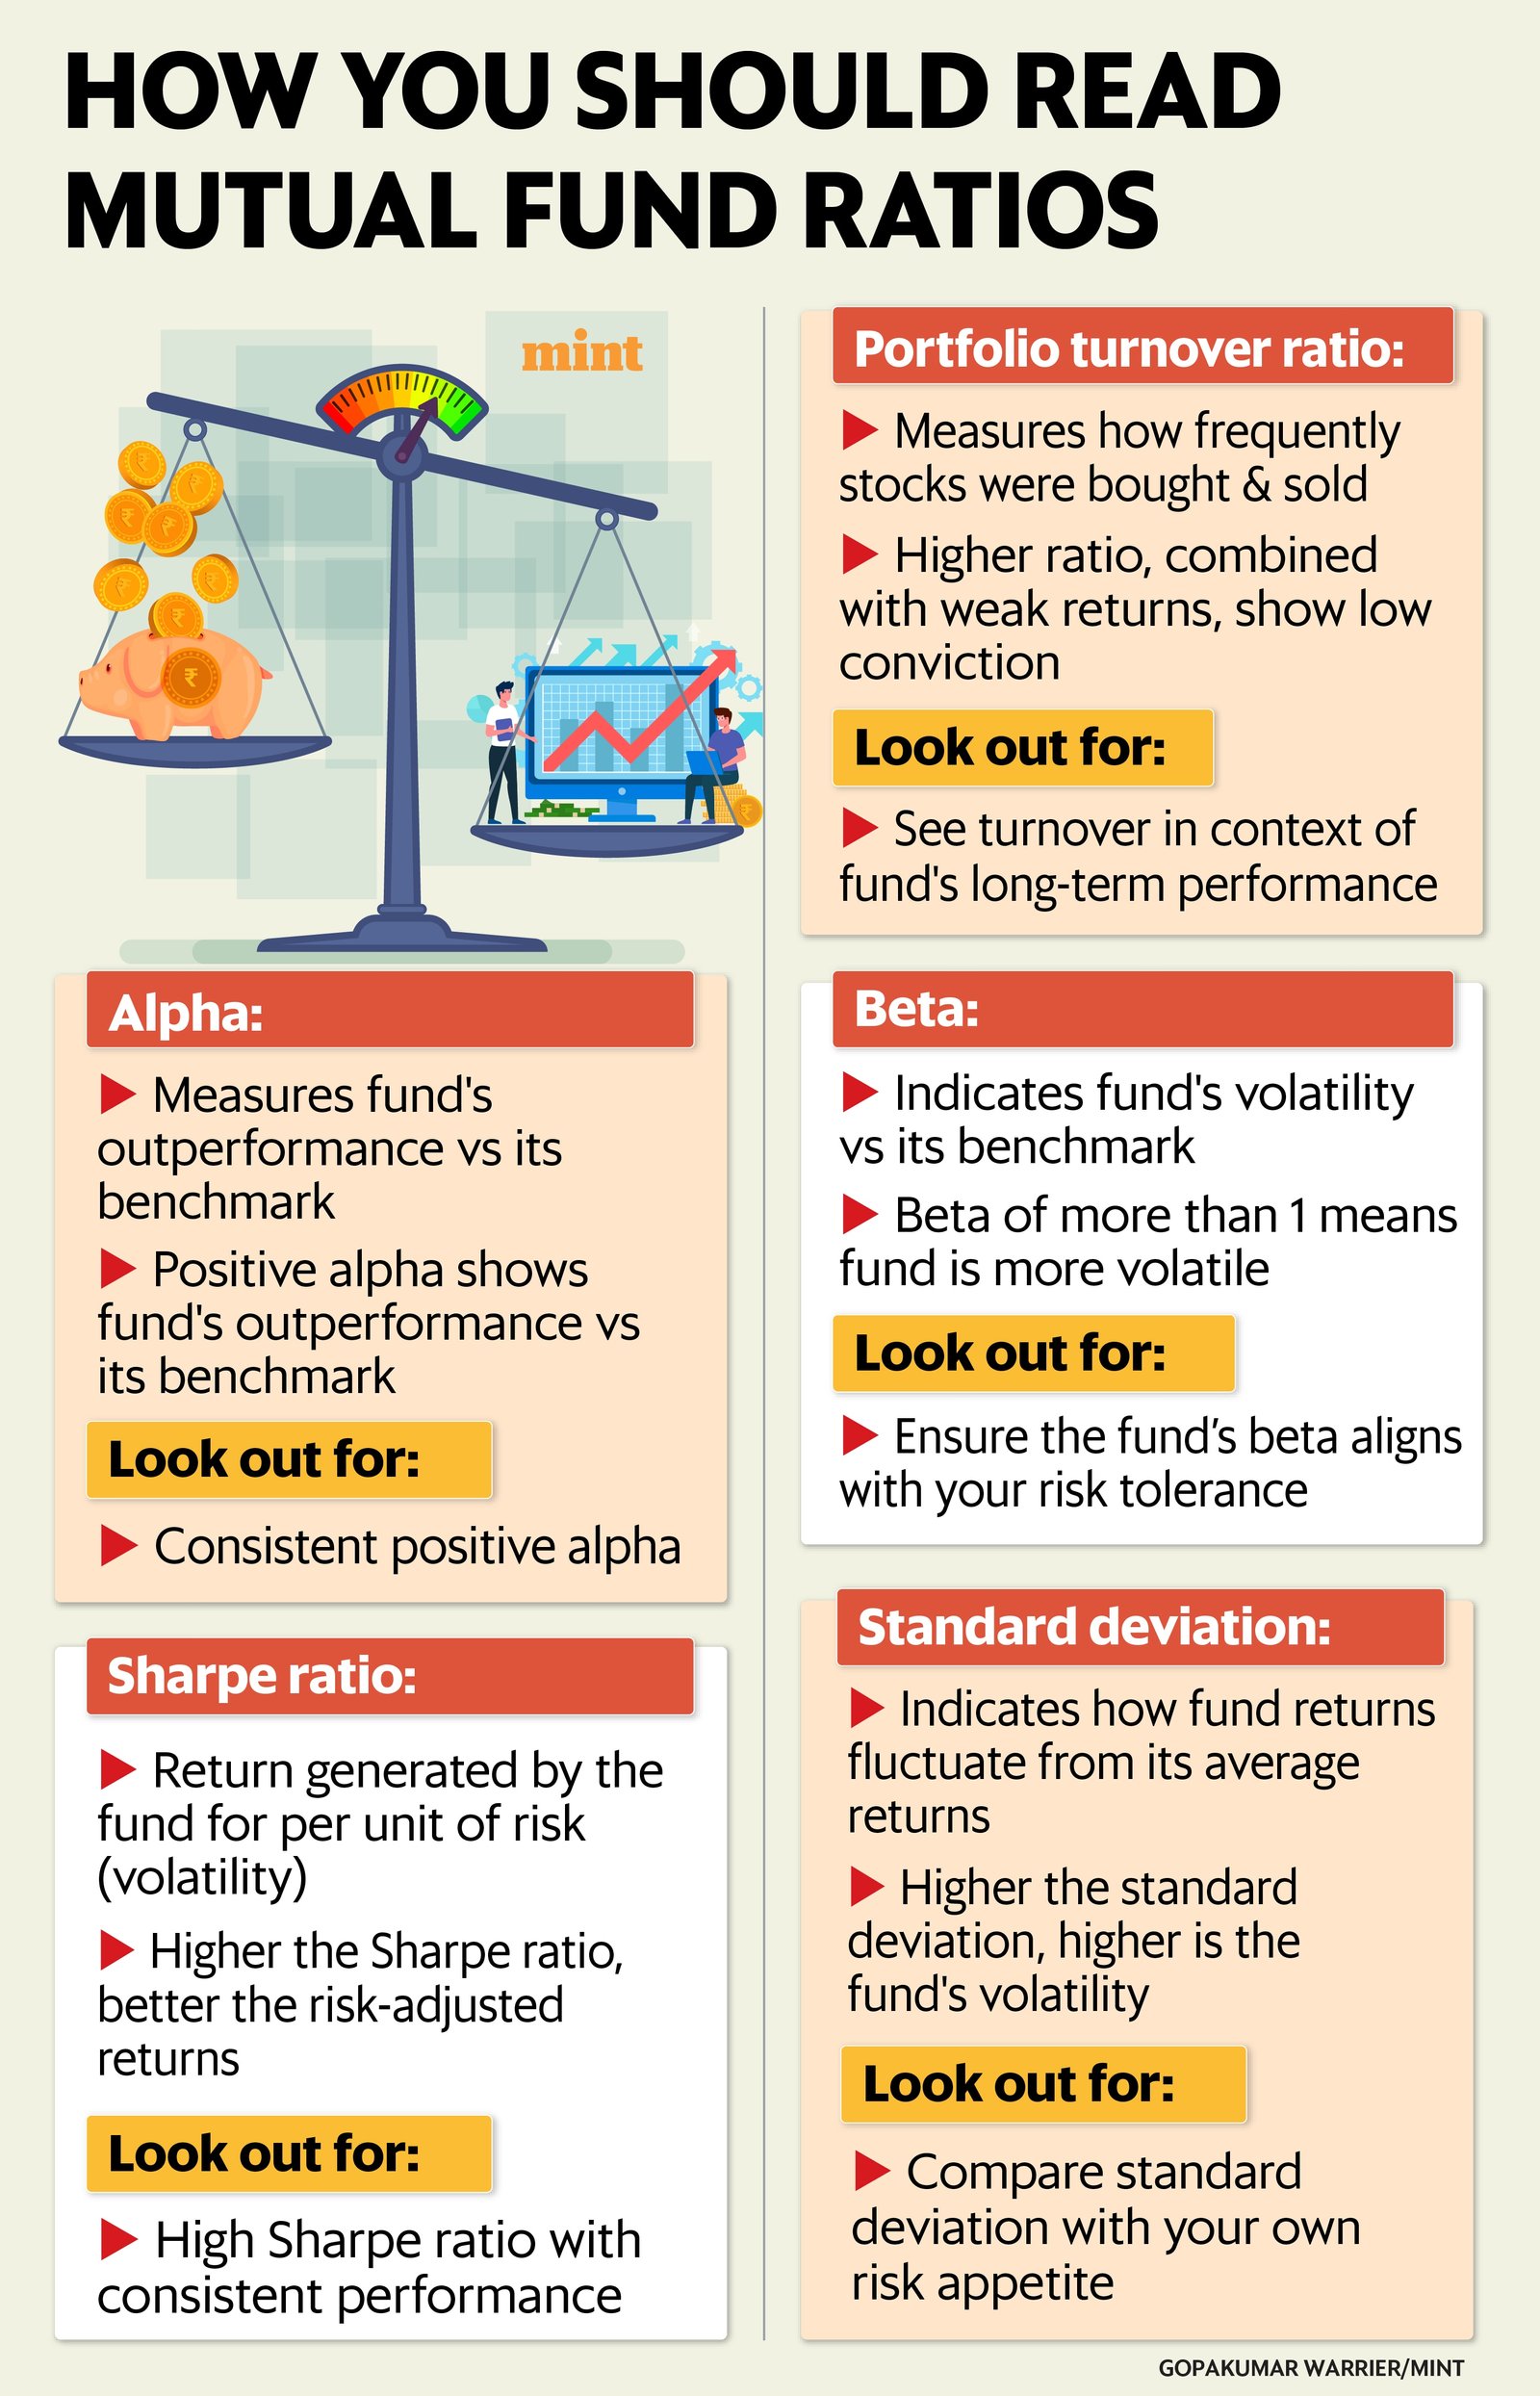
When it comes to mutual funds, picking schemes purely based on past returns may not be the smartest move. Returns tell only part of the story. Especially if you’re a do-it-yourself investor, your research should go one step further—to the ratios hidden in fund factsheets. These metrics reveal how well a fund performs relative to risk, cost, and conviction.
Alpha
Returns in isolation don’t say much—you need to see how the fund fares against its benchmark. Alpha measures a fund manager’s skill in generating extra returns over what’s expected for a given risk level.
A positive alpha means the manager has beaten the benchmark, while a negative one signals underperformance. Consistent alpha generation reflects the active manager’s ability to deliver long-term outperformance.
This is an important measurement, especially in an actively-managed fund. If the fund is not generating alpha, it can’t justify the higher asset management fee it charges to the investor. In such cases, investor is better-off with a passively-managed fund that simply tracks the benchmark index.

View Full Image
Sharpe ratio
The Sharpe ratio helps investors understand how well a fund has performed relative to the risk taken. It measures the additional returns a fund generates over a risk-free return—typically from short-dated government Treasury bill—for every unit of volatility. Simply put, a higher Sharpe ratio means better risk-adjusted performance.
“As and when valuations of mid and small-cap stocks run up, the Sharpe ratio rises. In growth cycles, this would mean efficient risk-taking,” says Ravi Kumar TV, co-founder of Gaining Ground Investment Services.
Mid- and small-cap funds often show high Sharpe ratios during bull markets because stocks in these segments get re-rated faster. But don’t rely on this number alone—a temporarily high ratio may simply reflect short-term aggressive bets paying off.
Portfolio turnover ratio
Fund managers in active schemes frequently buy and sell securities to generate returns. The portfolio turnover ratio captures how often this happens—essentially, how much of the portfolio changes over a year.
A low turnover ratio reflects a buy-and-hold approach driven by conviction. A high ratio isn’t necessarily bad—it could mean the manager is agile and locking in profits. However, excessive churning increases transaction costs and may erode long-term gains.
It could also point to low conviction if frequent trading fails to deliver better returns.
Beta
If you just wish to know how much more risky your fund is versus its benchmark index, look at the beta.
A beta of 1 means the fund moves in line with the index. A beta greater than 1 implies higher volatility, while less than 1 means a more defensive stance.
All passively managed funds like index funds and ETFs have a beta of 1 because they are designed to mirror the index. But if an actively managed fund’s beta is also close to 1, it may indicate that the fund’s portfolio largely overlaps with the benchmark— meaning it’s behaving just like an index fund, while charging active management fees.
Standard deviation
The standard deviation measures how much a fund’s returns fluctuate. A higher number means more volatility; a lower one indicates steadier performance.
Investors seeking stability should prefer funds with lower standard deviations. However, this ratio doesn’t differentiate between good and bad volatility—it counts both gains and losses as deviations from the average.
For instance, if your fund’s returns surge well above average, standard deviation still treats that as volatility—just as it does when returns drop below average.
Bottomline
These ratios — alpha, sharpe, turnover, beta, and standard deviation — form the guiding blocks of risk-aware investing. They don’t replace performance numbers but complete the picture, helping you choose funds that generate smarter, steadier returns.

