

A few AAII members asked us which categories and funds have performed best over the last 10 years. I discuss both the categories and exchange-traded funds (ETFs) with the highest 10-year annualized returns below.
I chose to use ETFs instead of mutual funds because there are proportionately more index funds in the ETF space. This is particularly the case when we narrow down the field to only those funds with 10-year track records. In contrast, the majority of mutual funds with 10-year records are actively managed. Studies of active managers have shown that outperformance is not persistent.
The digital assets category has the highest 10-year performance, with an annualized return of 68.5% through January 2026. The big return masks the roller-coaster ride investors would have had to stay on.
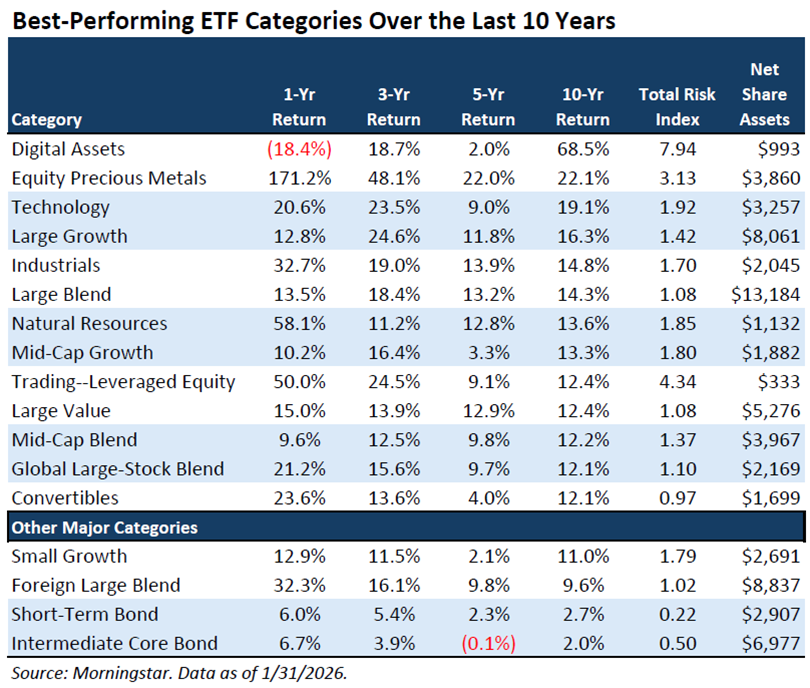
This is evident in the columns of the table I provided. The variance in the one-, three- and five-year returns relative to the 10-year annualized return illustrates how much individual-year returns have swung. Total risk looks only at the most recent three years, but it offers a sense of the category’s volatility relative to other categories. A risk score of 1.00 indicates average volatility. A score of 7.90 implies that you would have needed more than one dose of your preferred stomach medicine while holding one of the category’s funds.
The number of ETFs within a category matters. Grayscale Bitcoin Trust ETF ![]() (GBTC) is the only ETF in the digital assets category with a 10-year annualized return. Thus, the category’s 10-year annualized return is equal to the ETF’s 10-year annualized return.
(GBTC) is the only ETF in the digital assets category with a 10-year annualized return. Thus, the category’s 10-year annualized return is equal to the ETF’s 10-year annualized return.
It is also important to understand the role that survivorship bias plays. Only funds that are still in existence are included in the 10-year category returns.
The equity precious metals category ranks in second place with a 10-year annualized return of 22.1%. Last year’s big jump in gold prices caused this category to shine.
Whenever recent gains are large, annualized returns get boosted. That’s what we see here. The equity precious metals category’s strong 10-year annualized return masks the double-digit percentage losses realized in 2018, 2021 and 2022. Always look at the year-by-year returns before buying a fund.
Two larger category groups rank in third and fourth place: Technology and large growth, respectively. Both categories benefited from the performance of the so-called FAANG technology stocks, the growth of cloud computing and low interest rates in the years leading up to the coronavirus pandemic. In more recent years, the adoption of artificial intelligence (AI) has driven the prices of growth-oriented technology stocks even higher.
The Top-Performing ETFs
Grayscale Bitcoin Trust has been the best-performing ETF over the last 10 years.
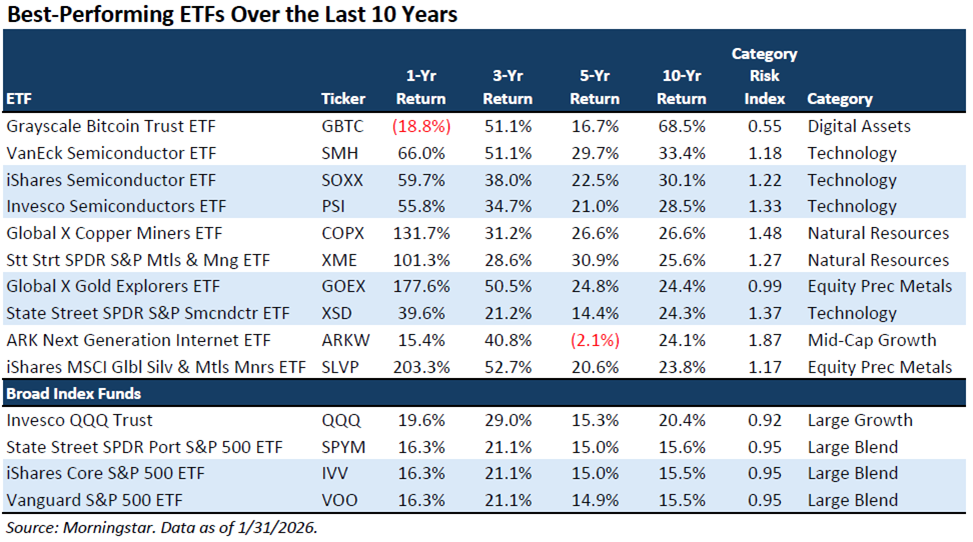
Three semiconductor ETFs rank in the next three top spots: VanEck Semiconductor ETF ![]() (SMH), iShares Semiconductor ETF
(SMH), iShares Semiconductor ETF ![]() (SOXX) and Invesco Semiconductors ETF
(SOXX) and Invesco Semiconductors ETF ![]() (PSI). All three are part of the technology category. The differences in returns between these three ETFs are related to each fund’s construction. VanEck Semiconductor can hold foreign companies, while iShares Semiconductor and Invesco Semiconductors invest solely in U.S. companies.
(PSI). All three are part of the technology category. The differences in returns between these three ETFs are related to each fund’s construction. VanEck Semiconductor can hold foreign companies, while iShares Semiconductor and Invesco Semiconductors invest solely in U.S. companies.
Note the dependence on a single industry. Should the returns of semiconductor stocks falter over the next 10 years, these ETFs will suffer.
I included a few broad market ETFs at the end of the best-performing ETFs table to provide comparisons. For 10-year annualized performance, Invesco QQQ Trust ETF ![]() (QQQ) ranks in 27th place overall out of the 615 non-leveraged ETFs with 10-year annualized returns. This ETF has nearly 63% of its portfolio allocated to technology stocks.
(QQQ) ranks in 27th place overall out of the 615 non-leveraged ETFs with 10-year annualized returns. This ETF has nearly 63% of its portfolio allocated to technology stocks.
State Street SPDR Portfolio S&P 500 ETF ![]() (SPYM) ranks in 85th place for its 10-year annualized return. iShares Core S&P 500 ETF
(SPYM) ranks in 85th place for its 10-year annualized return. iShares Core S&P 500 ETF ![]() (IVV) and Vanguard S&P 500 ETF
(IVV) and Vanguard S&P 500 ETF ![]() (VOO) rank a few spots below. The difference in performance and expense ratios between these three S&P 500 index funds is minimal.
(VOO) rank a few spots below. The difference in performance and expense ratios between these three S&P 500 index funds is minimal.
Making Use of Annualized Returns
Looking at annualized returns within categories can help you select an ETF or mutual fund, but be sure to look at calendar-year returns as well. Then, consider each fund’s category risk index, expense ratio (lower is better) and strategy followed. The actual strategy may be different than the fund’s name implies.
At the category level, momentum does occur, but so does reversion to the mean. Categories—especially narrower categories like equity precious metals or digital assets—experience periods of both outperformance and underperformance. This makes chasing the hottest categories risky.

Pessimism among individual investors about the short-term outlook for stocks increased in the latest AAII Sentiment Survey. Meanwhile, both optimism and neutral sentiment decreased.
Bullish sentiment, expectations that stock prices will rise over the next six months, decreased 1.1 percentage points to 38.5%. Bullish sentiment is above its historical average of 37.5% for the 11th consecutive week.
Neutral sentiment, expectations that stock prices will stay essentially unchanged over the next six months, decreased 8.0 percentage points to 23.3%. Neutral sentiment is below its historical average of 31.5% for the 82nd time in 84 weeks.
Bearish sentiment, expectations that stock prices will fall over the next six months, increased 9.1 percentage points to 38.1%. Bearish sentiment is above its historical average of 31.0% for the fourth time in 11 weeks.
The bull-bear spread (bullish minus bearish sentiment) decreased 10.3 percentage points to 0.4%. The bull-bear spread is below its historical average of 6.5% for the first time in 11 weeks.
This week’s special question asked AAII members how many quarter-point (0.25%) interest rate cuts they think the Federal Reserve will make this year.
Here is how they responded:
-
None: 6.3% -
One: 27.6% -
Two or three: 53.4% -
Four or more: 4.1% -
Not sure/no opinion: 8.6%