
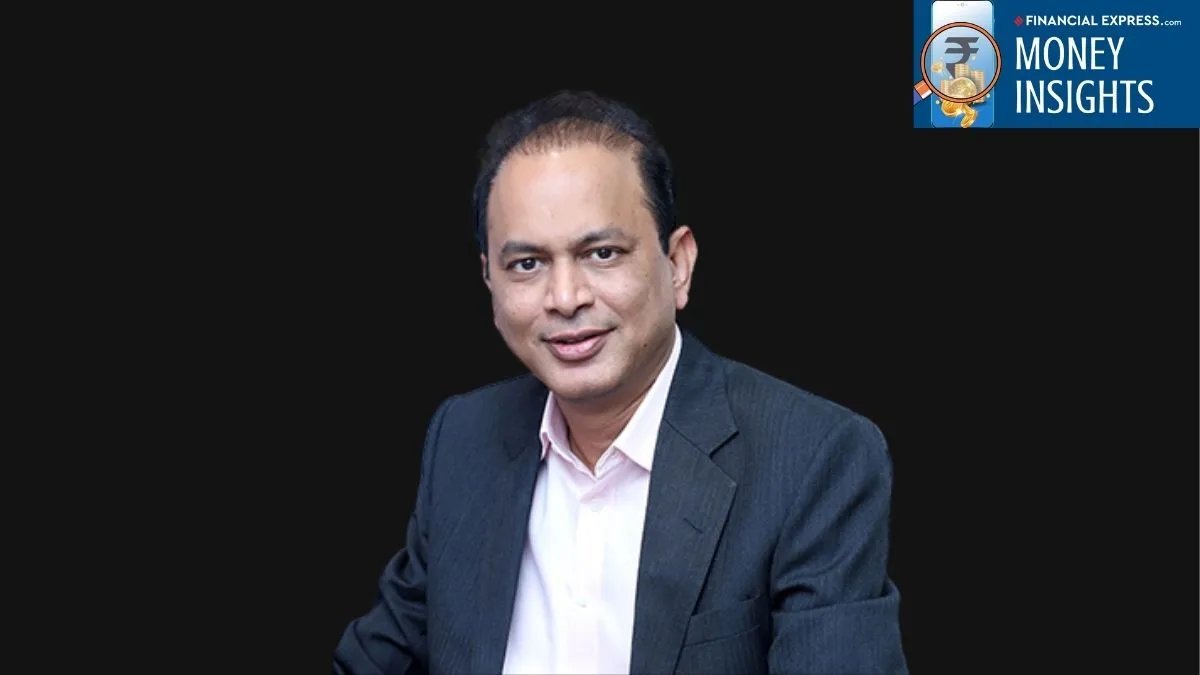
If you’ve been in the Indian equity markets for a while, actively investing in mutual funds, it is very likely that the name Sunil Singhania has left a lasting impression. Singhania took charge as Head of Equities and Chief Investment Officer (CIO) at Reliance Mutual Fund in April 2003. During his tenure, Reliance Mutual Fund became one of the largest asset management companies (AMCs) in India.
Reliance Growth Fund, the flagship mid-cap-focused scheme and crown jewel of the asset management company that Singhania managed, delivered massive multi-bagger returns—growing more than 100-fold over two decades. It was rated the best equity fund in the world by Lipper (a global financial data service that tracks and compares the performance of mutual funds) in 2006 over 5- and 10-year periods. For context, until the end of Singhania’s tenure, the fund had delivered a compounded annualised growth rate (CAGR) of around 23.8% since inception, significantly outperforming the benchmark S&P BSE 100 (11.6% CAGR) over the same timeframe.
Other than the flagship scheme, Singhania also managed the Reliance Mid & Small Cap Fund and Reliance Small Cap Fund (amongst others), which clocked handsome returns of 16.5% and 20.3% CAGR since their inception, respectively, and remarkably outperformed their benchmark indices until Singhania left his role at the AMC.
His long-term track record earned him recognition as a ‘star fund manager’, including the official accolade of being rated among the Best Fund Managers by Outlook Business in 2016 and 2017, based on a 10-year performance window.
Join now
He also gained international recognition as the first Indian elected to the Global Board of Governors of the CFA Institute, USA (2013–2019). As the Chairman of the institute’s Investment Committee, he oversaw more than $400 million in investments.
In March 2018, after spending 24 years managing equity investments, Singhania founded his own investment management company, Abakkus Asset Managers, with the ambition of making it India’s most revered Asset Manager over time. Today, it has already become popular, managing total assets of over Rs 41,483 crore across its portfolio management services (PMS), alternative investment funds (AIFs) and mutual funds business.
Singhania expanded into the mutual fund business with the launch of Abakkus Mutual Fund in August 2025, leveraging the firm’s deep research capabilities and disciplined investment frameworks.
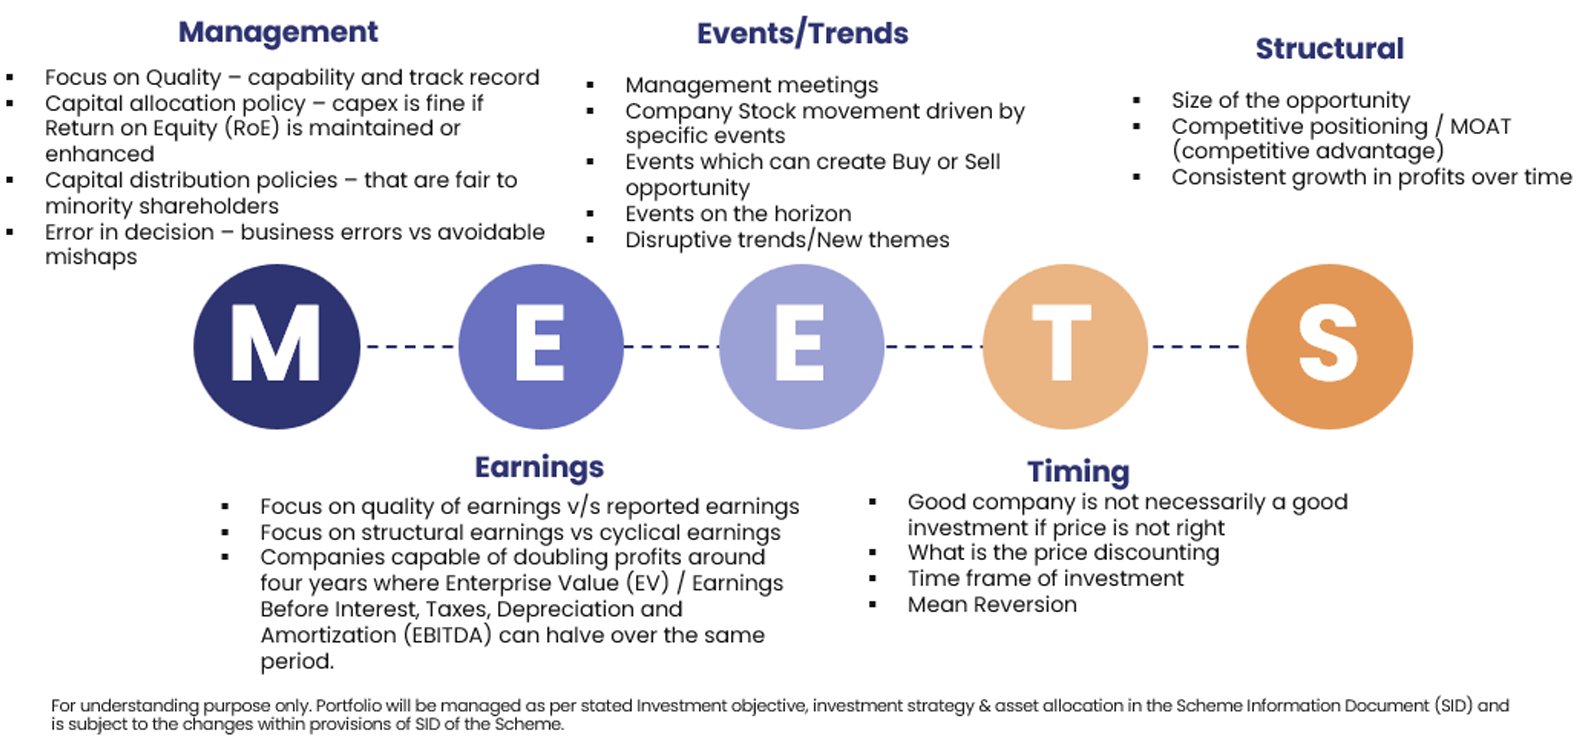
It highlighted that all funds from its stable will be actively managed and follow an in-house investment framework called ‘MEETS’ to evaluate key drivers of long-term value creation. MEETS refers to and focuses on:
Management pedigree and track record
Earnings quality and the ability of companies to multiply profits
Events/Trends that affect or disrupt operations
Timing of investment at a reasonable price
Structural aspects like the size of the opportunity and competitive positioning
The MEETS Framework: How Abakkus Selects Wealth Creators
Soon, in December 2025, Abakkus Mutual Fund launched its maiden equity scheme, the Abakkus Flexi Cap Fund, and a couple of months later, two more funds – Abakkus Small Cap Fund (in March 2026) and Abakkus Large & Mid Cap Fund (in July 2026).
Let’s examine whether Singhania’s alpha-focused boutique asset management firm, particularly its mutual fund schemes, such as Abakkus Flexi Cap Fund and Abakkus Small Cap Fund, are indeed creating wealth for its investors through its MEETS framework, which emphasises business sustainability and disciplined processes. Of course, with the caveat that the evaluation time period is short.
Abakkus Flexi Cap Fund
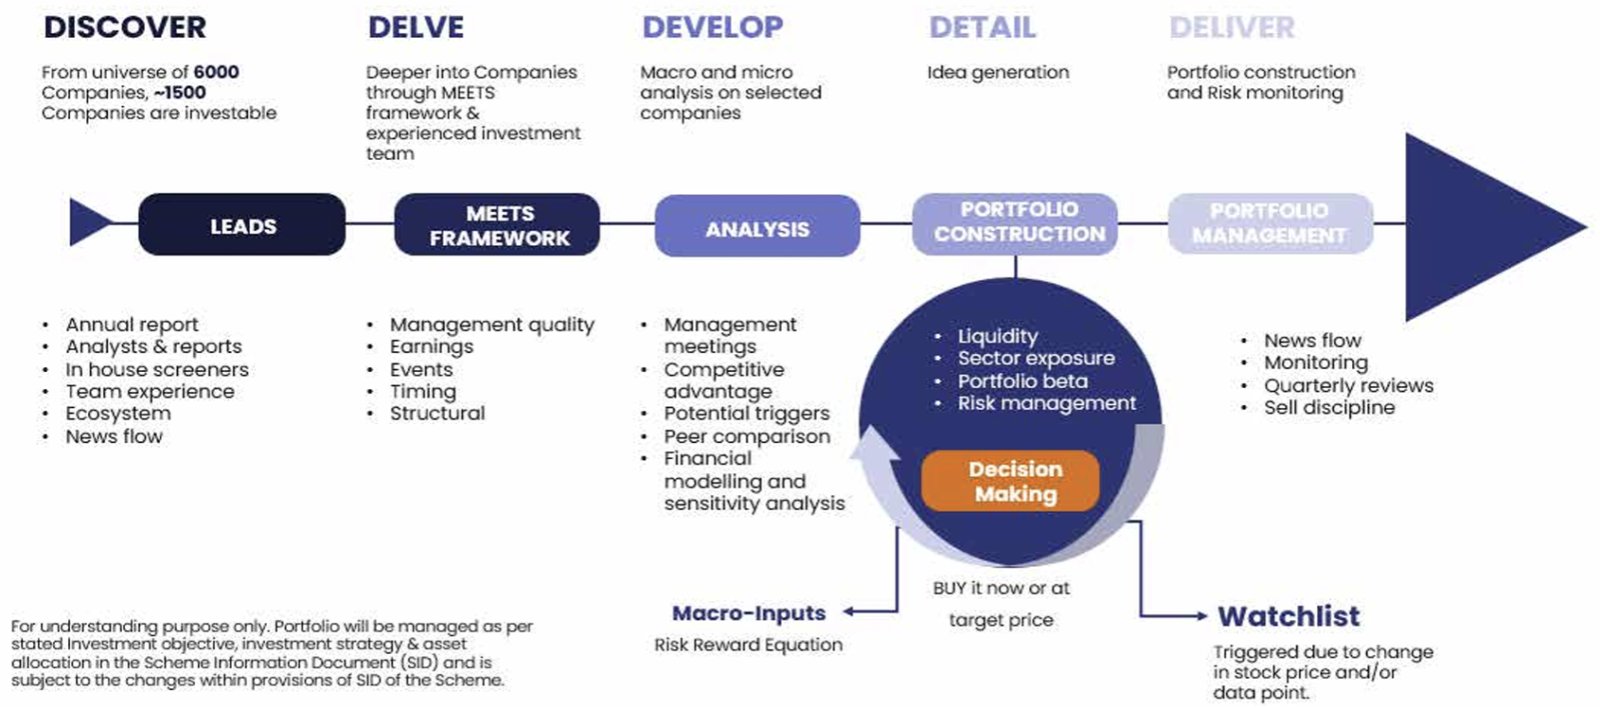
In nearly eight months since its launch, the Abakkus Flexi Cap Fund today manages assets worth Rs 6,338 crore, with persistent net inflows from investors and mark-to-market gains. It constitutes over 60% of the AUM of Abakkus Mutual Fund, which reflects that investors are banking on it to build wealth over time through the fund house’s 5D investment process:
5D Investment Process
Are investors being rewarded?
Report Card of Abakkus Flexi Cap Fund
| Absolute | |||
| 3 Mths (%) | 6 Mths (%) | SI Yr (%) | |
| Abakkus Flexi Cap Fund | 8.9 | 14.0 | 14.5 |
| Category Median | 4.3 | 2.9 | – |
| BSE 500 – TRI | 2.7 | 1.7 | – |
The returns data is as of 27 August 2026.
Source: Value Research
Since its inception in December 2025, Abakkus Flexi Cap Fund has posted an absolute return of 14.5% (as of 27 August 2026) under Sanjay Doshi (the dedicated fund manager for equities with over 20 years of experience). This is despite the intense volatility in the Indian equity market due to Trump 2.0’s tariff tantrums, escalating geopolitical tensions in West Asia, and heavy foreign investor outflows that weighed on the performance of Indian equities in the first three months of 2026.
Returns Amidst West Asia War – Abakkus Flexi Cap Fund vs Some Peers
| AUM (Rs in Cr.) | Absolute Returns | |
| 1-Jan-26 to 31-Mar-26 (%) | ||
| Abakkus Flexi Cap Fund | 6,338 | -9.1 |
| Parag Parikh Flexi Cap Fund | 148,429 | -9.8 |
| HDFC Flexi Cap Fund | 110,736 | -12.1 |
| Quant Flexi Cap Fund | 7,262 | -11.2 |
| PGIM India Flexi Cap Fund | 5,898 | -12.8 |
| BSE 500 – TRI | – | -13.9 |
Source: Value Research
From 1 January 2026 to 31 March 2026, when the markets were thrown off guard (due to the West Asia war), Abakkus Flexi Fund clocked a negative 9.1% return while the BSE 500 -TRI fell 13.9%.
In contrast, some of the leading peers, such as HDFC Flexi Cap Fund (AUM of over Rs 1.10 lakh crore) and Parag Parikh Flexi Cap Fund (AUM of over Rs 1.48 lakh crore), with longer performance track records, posted negative returns of 12.1% and 9.8%, respectively.
Even some of the more comparable peers in terms of asset size, such as Quant Flexi Cap (AUM of over Rs 7,262 crore) and PGIM Flexi Cap Fund (AUM of over Rs 5,898 crore), which have been in existence for decades, posted negative returns of 11.2% and 12.8%, respectively, during this period.
Abakkus Flexi Cap Fund Has Protected Downside Risk Better:
Abakkus Flexi Cap Fund experienced a lower drawdown and demonstrated better downside risk protection than many of its peers. This was mainly because the fund, having closed its inaugural NFO in late December 2025, was in an active deployment phase heading into Q1 2026. Rather than immediately deploying all its assets into equity, it was sitting on cash & cash equivalents. The liquidity helped arrest the decline in the fund’s net asset value (NAV).
Moreover, when allocating to equities, the fund tilted its portfolio toward large caps, particularly highly capitalised banking and financial institutions such as ICICI Bank, State Bank of India, and HDFC Bank. The tactical exposure to defensive and value-oriented segments, such as healthcare and capital goods, served to protect against downside risk. It avoided the overvalued mid-caps and momentum stocks, which some of its peers, Quant Flexi Cap and PGIM Flexi Cap, were indulging in. It also stayed focused on domestic equities, unlike its peer Parag Parikh Flexi Cap.
Returns of Abakkus Flexi Cap Fund vs Some Peers During Recovery Phase
| AUM (Rs in Cr.) | Absolute Returns | |
| 1-Apr-26 to 27-Aug-26 (%) | ||
| Abakkus Flexi Cap Fund | 6,338 | 25.6 |
| Parag Parikh Flexi Cap Fund | 148,429 | 5.8 |
| HDFC Flexi Cap Fund | 110,736 | 15.1 |
| Quant Flexi Cap Fund | 7,262 | 25.7 |
| PGIM India Flexi Cap Fund | 5,898 | 18.0 |
| BSE 500 – TRI | – | 14.7 |
Source: Value Research
In the ensuing four months or so, i.e., 1 April 2026 to 27 August 2026, Abakkus Flexi Cap Fund posted an absolute return of 25.6%, outperforming the BSE 500 – TRI (14.7%) by a remarkable margin.
In contrast, funds such as HDFC Flexi Cap, Parag Parikh Flexi Cap, and PGIM Flexi Cap clocked positive returns of 15.1%, 5.8%, and 18.0%, respectively. Quant Flexi Cap was the only scheme to outperform Abakkus, posting a 25.7% absolute return during this period.
The Smart Recovery from 1 April 2026:
In the recovery phase, Abakkus Flexi Cap, along with large-caps, deployed a significant portion of its capital into mid-caps, including high-alpha capital goods and consumer compounders such as Divi’s Laboratories, INOX India, and Dixon Technologies.
What’s important is that, since its launch, the fund’s portfolio turnover ratio has ranged between 12% and 15% (standing at around 14% as of late July 2026).
Current Top 10 Holdings of Abakkus Flexi Cap Fund
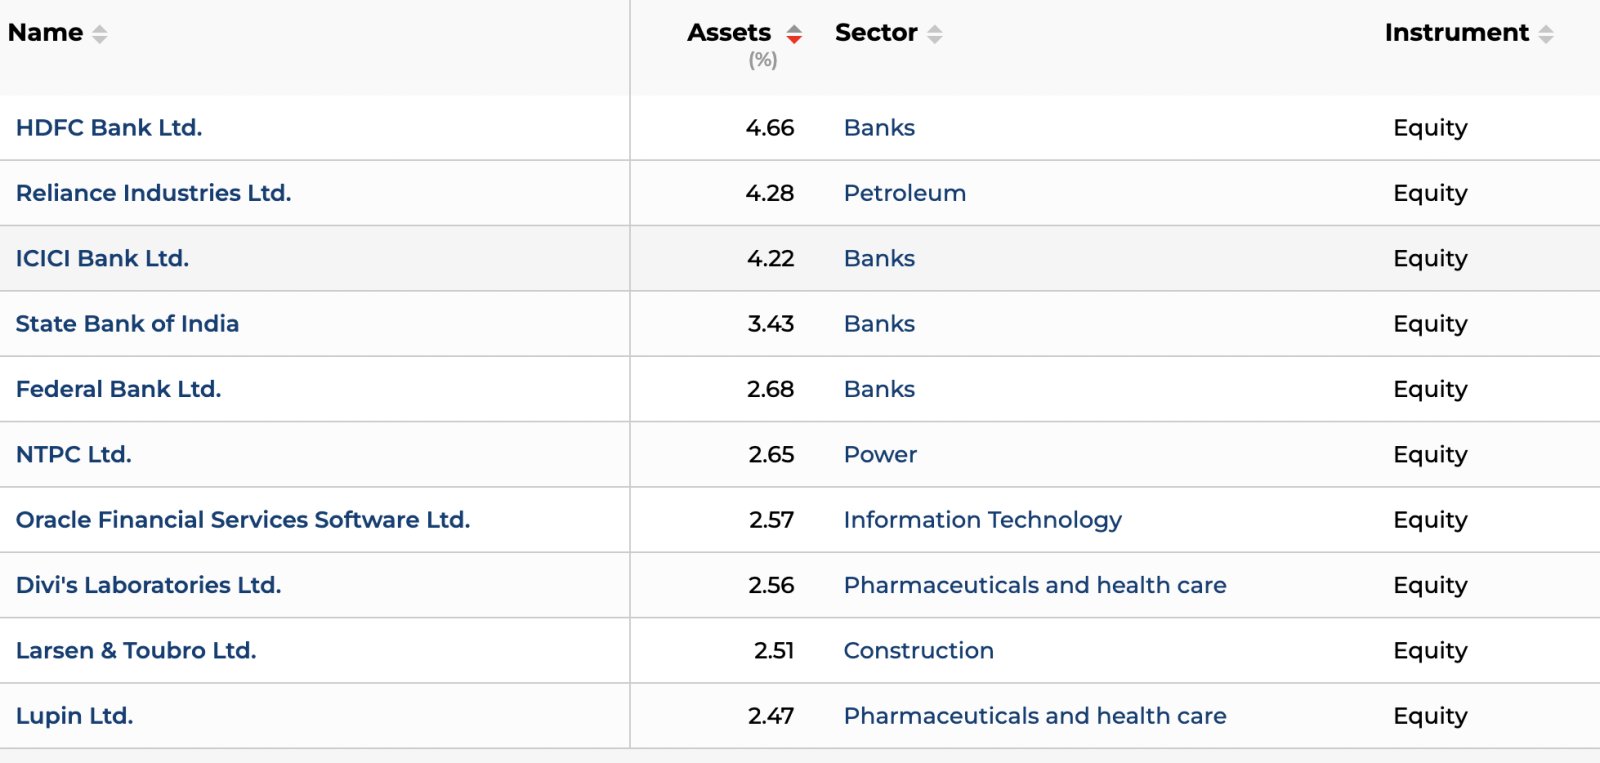
Source: Fund Factsheet
At present, the fund has 45 stocks in its portfolio, wherein the top 10 holdings account for 33.8%, making the portfolio well-diversified. Among the top 10 holdings, 8 are large-caps, and 2 are mid-caps.
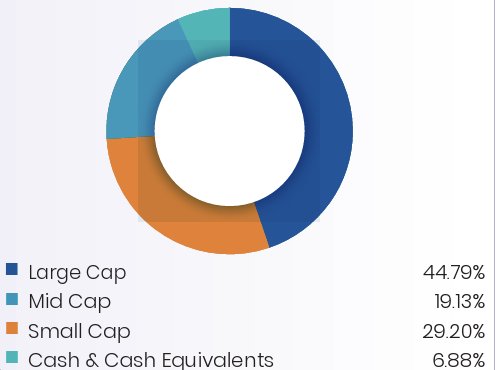
In the overall portfolio, nearly 45% are large-caps, 29% small-caps, and around 19% mid-caps. Financial services, capital goods, and healthcare are the top 3 sectors, comprising 51.2% of the portfolio. The fund’s price-to-book and price-to-equity ratios are approximately 3.7x and 24.8x, respectively.
Currently, it holds almost 7% in cash & cash equivalents.
Market Cap Allocation of Abakkus Flexi Cap Fund
Source: Fund Factsheet
Maintaining a 100% domestic Indian equity deployment strategy, Abakkus Flexi Cap has captured the full upside of domestic broad-market expansion and has insulated itself from foreign-exchange and overseas equity drag.
What about Abakkus Small Cap Fund?
This scheme was launched amid the war in West Asia in March 2026, and it has a track record of just over five months. That said, backed by investor demand for Singhania’s equity investment track record, the fund’s AUM has grown to over Rs 2,113 crore (from around Rs 1,800 crore raised through the NFO collections).
Is it delivering the performance needed for the confidence entrusted?
It is. Since its inception, Abakkus Small Cap Fund has clocked an absolute return of 26.7% (as of 27 August 2026), outperforming the BSE 250 Small Cap – TRI (24.1%) under Sanjay Doshi, its fund manager.
Report Card of Abakkus Small Cap Fund
| Absolute Returns | |||
| 1 Mth (%) | 3 Mths (%) | SI Yr (%) | |
| Abakkus Small Cap Fund | 3.5 | 12.3 | 26.7 |
| Category Median | 4.5 | 10.6 | – |
| BSE 250 SmallCap – TRI | 3.53 | 6.8 | – |
The returns data is as of 27 August 2026.
Source: Value Research
If we compare these returns from mid-March 2026, when it was launched, until 27 August 2026 with other leading peers such as Nippon India Small Cap Fund (AUM of over Rs 78,957 crore) and HDFC Small Cap Fund (AUM of over Rs 41,679 crore) that have a longer track record of decades, they have clocked 23.0% and 14.3%, respectively (as of 27 August 2026).
Abakkus Small Cap Fund, with a manageable initial AUM, was able to dynamically buy high-conviction, small-cap compounders without causing adverse market impact. Plus, the fund also allocated to cash in mid-March 2026 when small-caps were consolidating.
Abakkus Small Cap Fund’s Astute Capital Deployment Helped During the Recovery Phase
It gradually deployed capital into depressed valuations, riding the recovery curve into mid-2026. The fund’s portfolio was tilted to capital goods (such as ZF Commercial Vehicle, Gabriel India, Sansera Engineering) and healthcare stocks (such as Dr Lal PathLabs), which helped many of these companies report strong Q1FY 27 earnings. Whereas Abakkus Small Cap Fund peers, with massive assets and a diverse portfolio of 100-200 stocks, maintained higher allocations to large and mid-sized companies, which slowed relative performance.
When evaluated against more comparable peers in terms of asset size, such as Union Small Cap Fund and PGIM India Small Cap, which have longer track records, these funds fared better, posting absolute returns of 32.5% and 29.6%, respectively, from mid-March 2026 to 27 August 2026. Both these funds maintained high active share with heavy allocations to low-overlap, micro- to small-cap stocks. Union Small Cap’s concentrated stock-selection strategy, in particular, allowed it to capture outsized gains during mid-2026 market rallies. That said, the Abakkus Small Cap has generated competitive, respectable returns. And to clock returns, the fund hasn’t churned the portfolio very often. Since its launch in mid-March 2026, the portfolio turnover ratio has hovered between 12-15% (standing at 15% as of late July 2026).
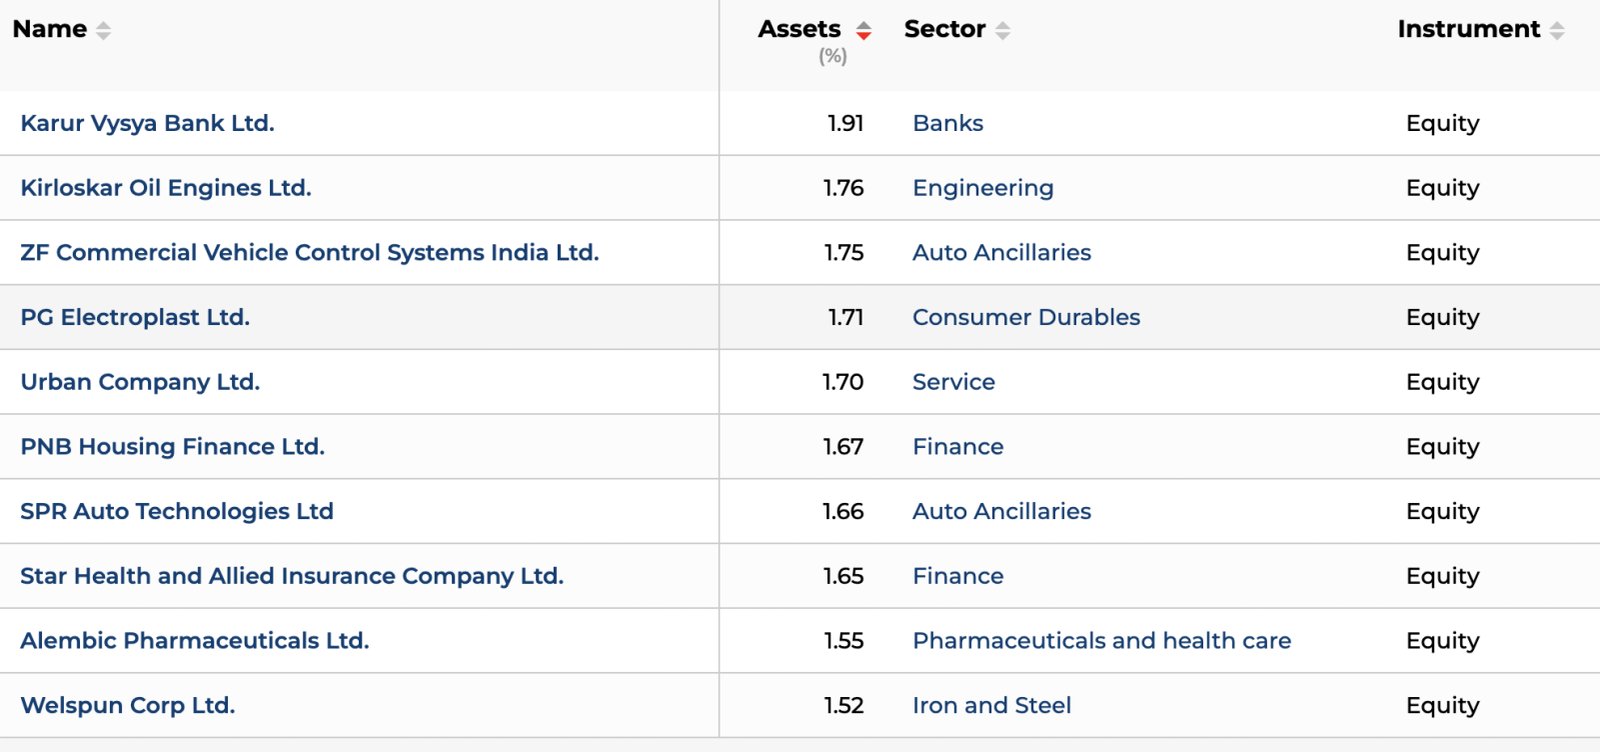
Top 10 Holdings of Abakkus Small Cap Fund
Source: Fund Factsheet
Currently, the fund has 62 stocks in its portfolio, of which the top 10 holdings account for 17.4% of the overall portfolio. Among the top 10 holdings, 6 are small-caps, and 4 are mid-caps.
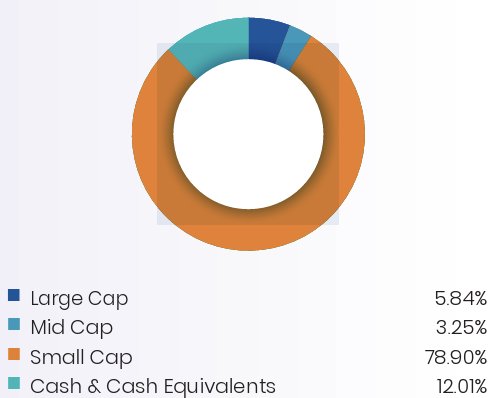
In the overall portfolio, mid-caps are barely around 3%, large-caps nearly 6%, while 79% is held in small-caps. Financial services, capital goods, and healthcare are the top 3 sectors, comprising 46.1% of the portfolio. Currently, it holds around 12% in cash & cash equivalents.
Market Cap Allocation of Abakkus Small Cap Fund
Source: Fund Factsheet
With a portfolio of 62 stocks (price-to-book and price-to-equity ratios of around 3.7x and 27.6x, respectively), the Abakkus Small Cap Fund has an optimally sized portfolio for its current level of assets under management.
To conclude
Overall, it appears that both Abakkus Small Cap Fund and Abakkus Flexi Cap, strictly adhering to Singhania’s MEETS framework, are delivering alpha for their investors. Singhania and his team are once again proving their prowess by creating wealth for investors through robust investment processes and systems.
You may consider adding equity schemes from Abakkus Mutual Fund to your 2026 watchlist, in line with your risk appetite and investment objective, provided your investment horizon is at least 5-7 years.
Make sure your allocation to any Abakkus Mutual Fund scheme is not skewed solely because Singhania is at the helm. Approach mutual funds sensibly based on the allocation that best suits you.
Happy investing!
Note: We have relied on data from www.valueresearchonline.com, www.financialexpress.com, and the factsheets published by the respective fund houses throughout this article. Only in cases where the data was not available, have we used an alternate but widely used and accepted source of information.
Returns data as of 27 August 2026. Direct Plan and Growth Option Considered.
Standard Deviation is a measure of the total volatility of the fund. The Sharpe Ratio is a measure of risk-adjusted return that shows how much excess return an investment generates for each unit of risk taken.
Portfolio data as of 31 July 2026. The average price-to-book value ratio and price-to-equity ratio of all underlying stock holdings, weighted by their portfolio weights, are considered.
Disclaimer:
Disclaimer: The above content is for informational purposes only. Mutual Fund investments are subject to market risks. Past returns are not indicative of future returns. Please consult your financial advisor before investing.
Rounaq Neroy has over 20 years of experience in the financial markets and investments. He is a close observer of the Indian economy and writes deeply on the capital markets, mutual funds, stocks, precious metals, asset allocation, wealth management, and investment strategy. His editorials provide interesting, actionable investment ideas to guide readers in the journey of wealth creation and make wise decisions. Rounaq was the Head of Content at PersonalFN (Quantum Information Services Pvt. Ltd.), which also owns Equitymaster.com – India’s oldest and trusted equity research house.