

I have selected four US ETFs available for purchase in Japan to build a portfolio. Rather than focusing on the specific stocks themselves, I would like to share the philosophy behind how to select them, how to combine them, and what to change depending on the timing. These four stocks and their allocation ratios are just one example of how to structure a portfolio and do not constitute a recommendation for any specific product.
As a premise, this discussion covers only the US dollar-denominated portion of your total assets, and the figures are also in US dollars. It is assumed that you have separately prepared a defensive layer, such as yen-denominated deposits or government bonds for individuals.
There are three things I want to verify: which assets remain, how to combine them, and what to change over time.
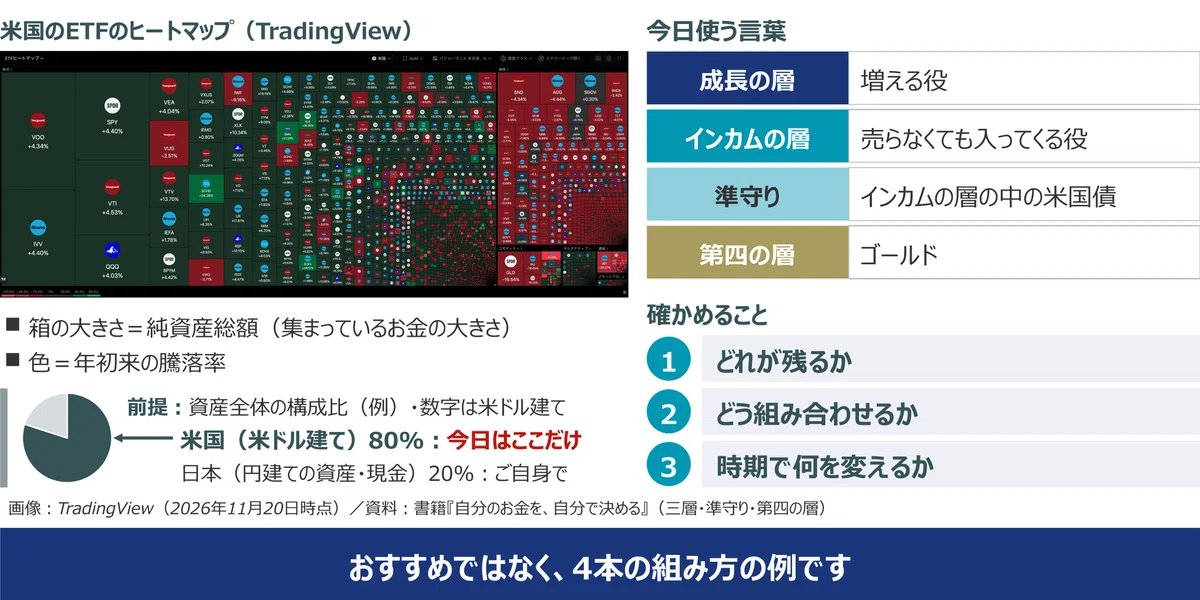
Arranging by size and dividing into layers
First, I looked at US ETFs available in Japan in descending order of total net assets and applied them to the layers described in my book. The growth layer serves to increase assets, while the income layer provides cash flow without needing to sell. Since government bonds for individuals are yen-denominated, they cannot be placed within the US dollar-denominated portion, so I use US corporate bonds within the income layer as a ‘quasi-defensive’ asset. Gold is a ‘fourth layer’ separate from the other three.
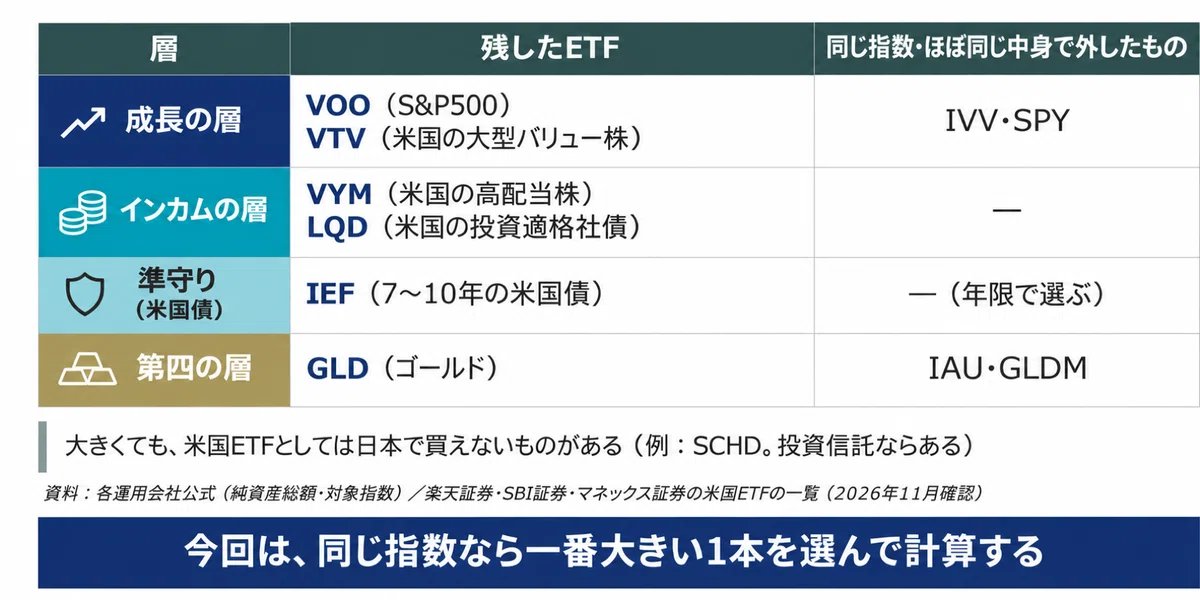
I chose VOO (S&P 500) and VTV (large-cap value stocks) for the growth layer, VYM (high-dividend stocks) and LQD (US investment-grade corporate bonds) for the income layer, IEF (7-10 year US Treasury bonds) for the quasi-defensive layer, and GLD (gold) for the fourth layer. While there are other S&P 500 ETFs like IVV and SPY, I have chosen the single largest one for the same index.
Some ETFs are large but not available in Japan. For example, SCHD is available as an investment trust but cannot be bought as a US ETF, and since there is no data from 2008, I used VYM for the calculations.
Defining the four-slot framework using stock-type and flow-type models
In my book, I categorize the forms of peace of mind into stock-type and flow-type.
The stock-type is a form where you find peace of mind in the total amount of assets. I used two ETFs for the growth layer, VOO and VTV, and added IEF for the quasi-defensive layer and GLD for the fourth layer. Since the focus is on increasing assets, I did not include high-dividend stocks or corporate bonds, leaving the role of preparing for declines to US Treasury bonds and gold.
The flow-type is a form where you find peace of mind in the money coming in. I used one ETF for the growth layer, VOO, and placed VYM and LQD in the income layer, with IEF as the quasi-defensive asset. This is because I wanted to ensure income from both dividends and interest.
There is no right or wrong answer, and I think it is fine to mix them as well.

Looking at the movement of each asset during two types of declines
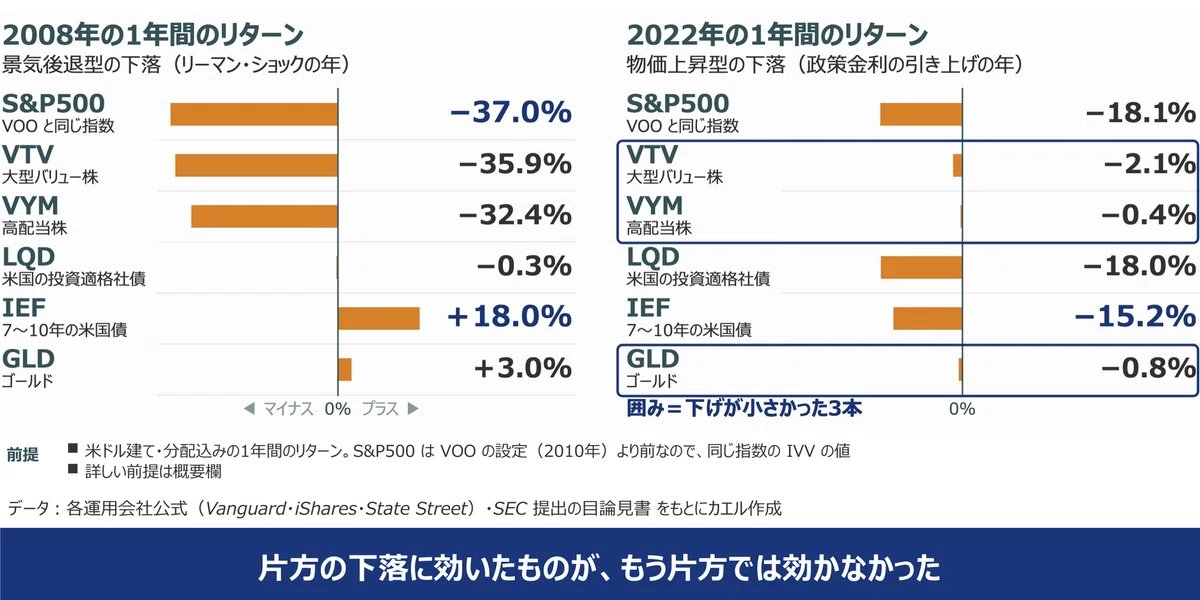
Market declines have patterns. The 2008 Lehman Shock was a recessionary decline where the economy worsened and stocks fell. 2022 was an inflationary decline where prices rose and policy interest rates were hiked.
In 2008, the S&P 500 fell by 37.0% over the year, whereas the US Treasury bond ETF IEF rose by 18.0%. This is because when the economy worsens, US Treasury yields fall, causing bond prices to rise.
However, in 2022, IEF also fell by 15.2%. When US Treasury yields rise, bond prices fall. The assets that saw smaller declines that year were VTV (value stocks), VYM (high-dividend stocks), and GLD (gold).
What worked for one type of decline did not work for the other. Therefore, I thought I wanted to include the roles for both within the four ETFs.
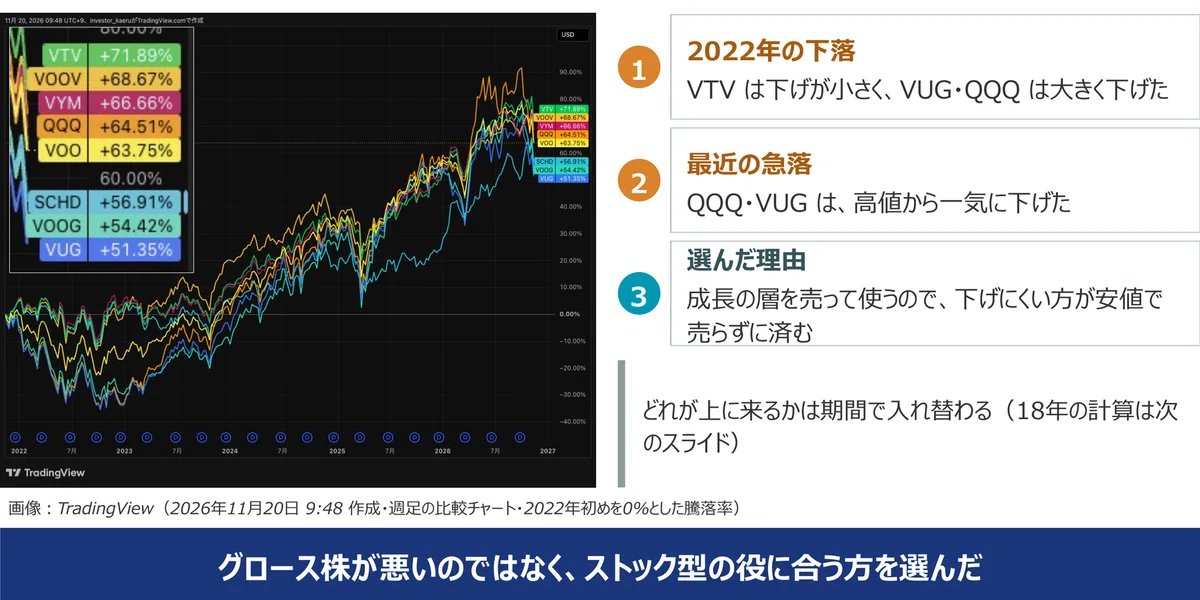
Why I chose VTV
For the second ETF in the growth layer, I considered growth stocks like VUG and QQQ, but I chose VTV. During the 2022 decline, VTV saw a smaller drop, while VUG and QQQ fell significantly. I believe that when interest rates rise, growth stocks are more prone to price declines.
In the recent sharp decline, the high-momentum QQQ dropped sharply from its highs, and since the beginning of 2022, QQQ is up 64.51% compared to VTV’s +71.89%.
Since the stock-type assets are sold and used, the smaller the decline, the less you have to sell at a low price. It is not that growth stocks are bad, but rather that if I can get the same return with a stock-type asset, I chose the one with lower risk as the approach. Which one comes out on top changes depending on the period.
What happens if you swap the contents?
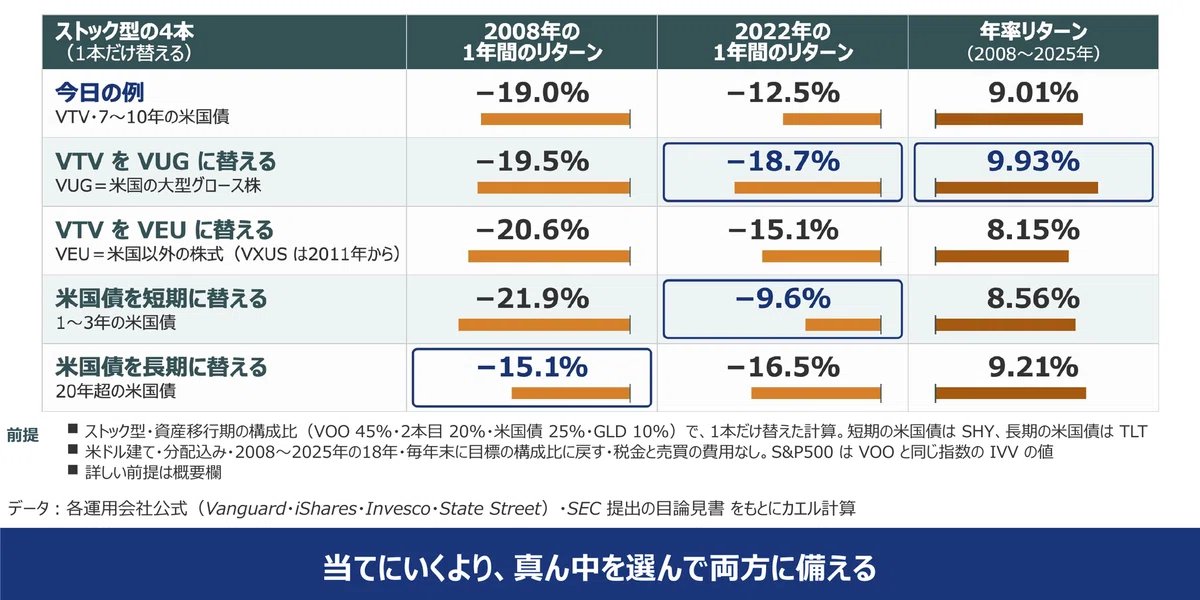
I tried calculating for the 18 years from 2008 to 2025 by swapping only one of the stock-type assets.
When swapping VTV for the large-cap growth stock VUG, the annual return was 9.93%, which was higher than the 9.01% in today’s example. However, the return for the single year of 2022 was -18.7%, which is almost no different from holding only the S&P 500. This means that the combination with the higher return was not necessarily more resilient to both types of declines.
When swapping VTV for VEU, which consists of non-US stocks, the annual return over these 18 years was 8.15%, lower than in today’s example. However, since US stocks were very strong during this period, I leave it to you to decide how to handle international diversification.
If you shorten the duration of US Treasury bonds, the decline in 2022 will be smaller, but the decline in 2008 will be larger. If you lengthen it, the opposite is true. Rather than trying to guess which decline will come, I chose a form that prepares for both to some extent with a medium duration. However, if interest rates fall due to a US recession, the yen may strengthen against the dollar, which could potentially diminish the defensive meaning when viewed in yen. I am still considering how to handle currency hedging.
The only thing that changes over time is the allocation ratio
While keeping the 4 ETFs fixed, I only change the allocation ratio during the asset accumulation phase, asset transition phase, and asset utilization phase.
For stock-type assets, IEF is 15% of the allocation during the asset accumulation phase, but I increase it to 40% during the asset utilization phase. This is because a decline during the period when you are using the assets results in actual losses, unlike during the period when you are accumulating them. I kept GLD at 10%. Even in books, 10% is generally considered the upper limit for gold.
For flow-type assets, I reduce VOO from 50% of the allocation in the asset accumulation phase to 30% in the asset utilization phase, and use the reduced portion to increase VYM, LQD, and IEF to thicken the incoming cash flow. As assets grow, the same percentage decline results in a larger monetary amount. If that concerns you, I think it is safer to lower the risk.
This allocation ratio is just an example. I hope you will adjust it based on the range of decline you can personally withstand.

The flow of money when withdrawing
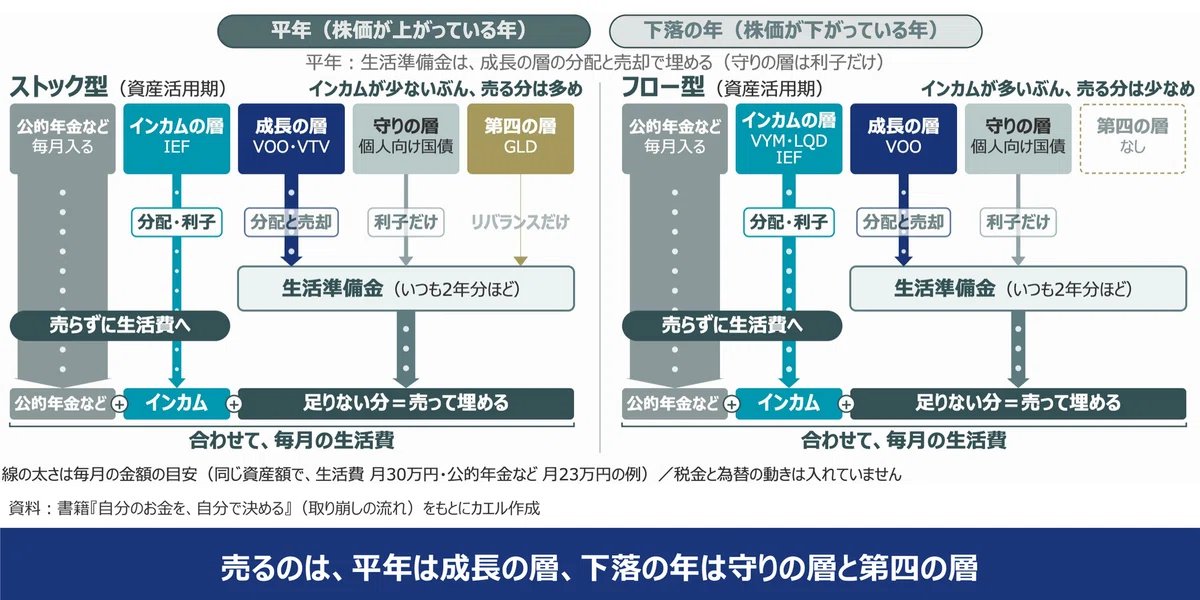
The concept is simple: subtract income, such as public pensions, from your living expenses and sell only the amount that is lacking. Since distributions and interest from the income tier, including public pensions, go directly toward living expenses, you do not need to sell those assets.
The shortfall is covered by your living reserve fund, and you alternate where you replenish that reserve fund between normal years and years of decline. In normal years, you replenish it through distributions and sales from the growth tier. In years of decline, you avoid selling the growth tier at low prices and rely only on distributions, covering the remaining shortfall from the defensive tier’s individual government bonds or the fourth tier’s gold.
With the flow-type approach, because there is more money coming in from the income tier, you need to sell less for the same amount of living expenses.
Comparing 6 examples using numbers
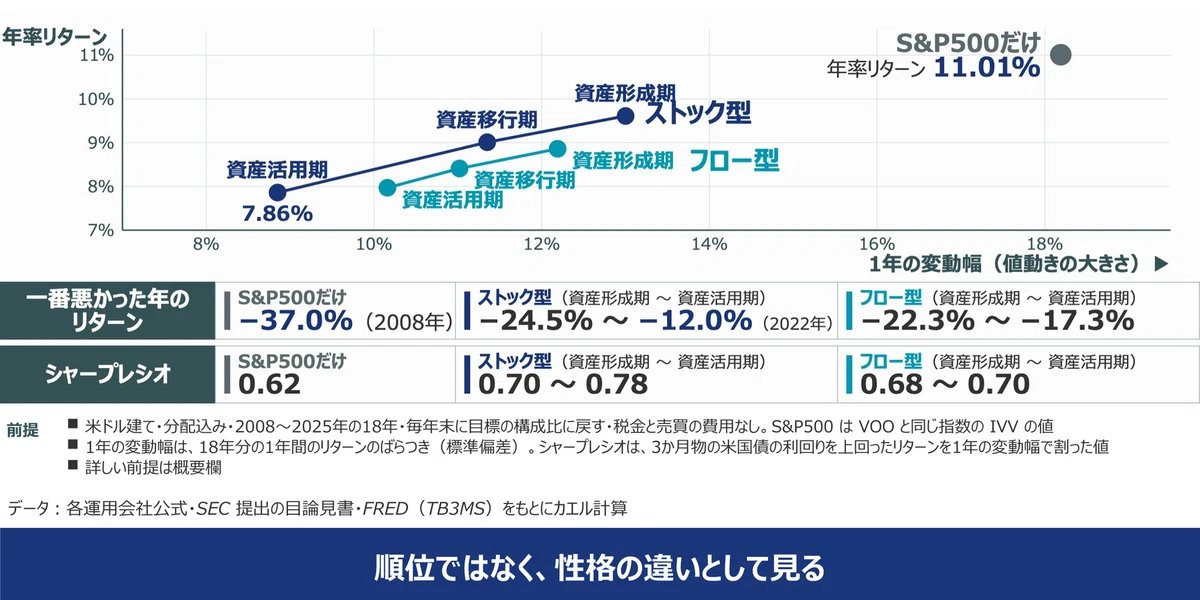
Over the 18 years from 2008 to 2025, I compared the 6 examples with holding only the S&P 500. The annualized return was highest for the S&P 500 alone at 11.01%.
What changes is the magnitude of the decline. The return in the worst year was -37.0% in 2008 for the S&P 500 alone, while it was -12.0% for the stock-type asset utilization phase example. By giving up about 3 percentage points in annualized return, the decline was about one-third when comparing the worst years.
However, these 18 years were a period when US stocks were very strong. Since the numbers will change if the period changes, I hope you will view this as a difference in characteristics rather than a ranking.
Summary: Answers to 3 questions
First, which ones remain? Choosing the largest single ETF for the same index, VOO and VTV, VYM and LQD, IEF, and GLD remained. If you are concerned about expense ratios, I think it is fine to choose others in the same index or asset class.
Second, how to combine them? This is a structure that includes both US bonds, which were effective against recessionary declines, and value stocks, high-dividend stocks, and gold, which had smaller declines during inflationary drops. While this does not mean you can avoid both types of declines, I believe you can provide a certain level of resistance.
Third, what to change over time? Keeping the 4 ETFs as they are, you will increase the composition ratio of US bonds and the income tier as you move toward the asset utilization phase.
When buying in Japan, LQD and IEF pay monthly distributions, so they cannot be purchased in the NISA growth investment quota. Since there are similar products among TSE ETFs and investment trusts, I think it is a good idea to look for them.
If your assets are still small, you do not need to be fixated on these 4 ETFs. This is because increasing the money you put into investments is more effective. I hope you will decide based on what gives you peace of mind.

*This article represents my personal views and is not intended to recommend specific products or provide investment advice. Past performance does not guarantee future results. The data and figures mentioned are as of the time of writing and may become outdated due to changes in market conditions. Please make investment decisions at your own discretion and responsibility.
“Frog’s Investment Vlog” publishes asset status and investment performance based on real investment experience! I share useful investment tips for individual investors, as well as information on index funds and high-dividend investments, so please take a look!
#FrogInvestmentVlog #FrogInvestmentBlog #USETF #Portfolio #AssetAllocation #VOO #VTV #VYM #USBonds #Gold