

primeimages/E+ via Getty Images
Investment Thesis
The Fidelity Enhanced Small Cap ETF (NYSEARCA:FESM) launched on November 20, 2023, but its predecessor mutual fund has an extensive track record dating back to December 2007. With a reasonable 0.28% expense ratio and strengths in the value and growth factors, FESM will likely outperform its benchmark, the iShares Russell 2000 ETF (IWM), over the long run. However, that’s setting the bar low, and I prefer the many higher-quality alternatives available in the small-cap blend space.
FESM Overview
Strategy and Performance
According to its fact sheet, FESM is an actively managed small-cap fund that benchmarks against the Russell 2000 Index. The strategy description provided is as follows:
Normally investing at least 80% of assets in common stocks included in the Russell 2000 Index, which is a market capitalization-weighted index designed to measure the performance of the small-cap segment of the U.S. equity market. Generally using computer-aided, quantitative analysis of historical valuation, growth, profitability, and other factors to select a broadly diversified group of stocks that may have the potential to provide a higher total return than that of the Russell 2000 Index.
I’ve identified 20 small-cap blend ETFs with a ten-year track record. Sadly, FESM’s 144.35% total return ranks just #13 and only 10-12% above IWM and the Vanguard Russell 2000 ETF (VTWO). Historically, the Index is a pretty easy benchmark to beat, and there are several funds with better track records and lower expense ratios you may want to look at first.
The Sunday Investor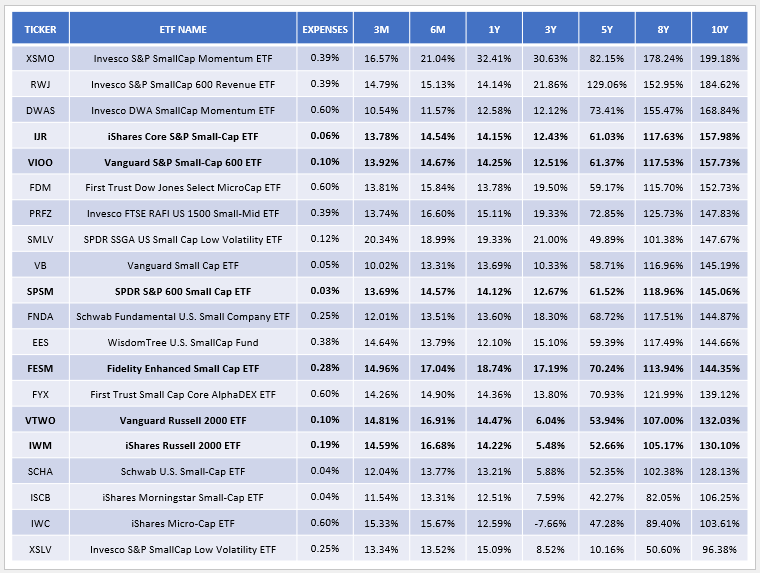
For example, the iShares Core S&P Small-Cap ETF (IJR) and the Vanguard S&P Small-Cap 600 ETF (VIOO) outperformed FESM by 13-14% over the last ten years, and they track the same Index with expense ratios of just 0.06% and 0.10%, respectively. The SPDR S&P 600 Small Cap ETF (SPSM) is now the lowest-cost fund tracking this Index at 0.03%. Its long-term returns are lower, but that’s because it tracked different Indexes prior to January 24, 2020.
Lastly, consider FESM’s 291.74% total return since December 31, 2007. It’s above IWM’s 255.44% but lags behind IJR’s 337.93% total return.
Morningstar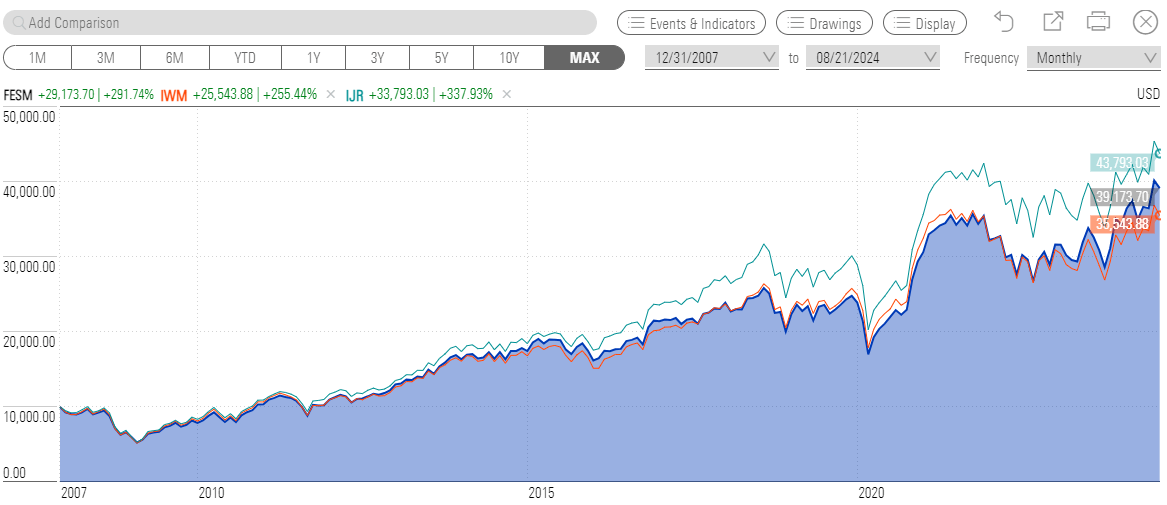
Using this chart data, I calculated FESM’s average monthly return to be 0.86% compared to 0.82% and 0.92% for IWM and IJR, so it doesn’t appear the dataset is skewed for or against FESM. Furthermore, FESM’s annualized standard deviation was 20.57% compared to 21.10% and 20.79% for IWM and IJR, so it doesn’t seem to be any better from a risk management perspective, either. All three ETFs declined by 20-22% in March 2020 and 28-30% between October and November 2008.
To summarize FESM’s performance track record, it’s delivered better results than its benchmark, but the Russell 2000 Index is easy to beat. Simple quality screens like the ones S&P Dow Jones Indices uses for the S&P 1500 Composite Index, which includes the S&P SmallCap 600 Index, appear sufficient. For further reading, here’s a great resource describing the differences between the two benchmarks.
FESM Sector Allocations and Top Ten Holdings
The following table highlights the sector allocation differences between FESM, IWM, and SPSM. I’ve also included the Fidelity Small-Mid Multifactor ETF (FSMD) and the iShares U.S. Small-Cap Equity Factor ETF (SMLF) as comparators. These two funds select slightly larger stocks by market cap but also boost quality, something often lacking in the small-cap category.
The Sunday Investor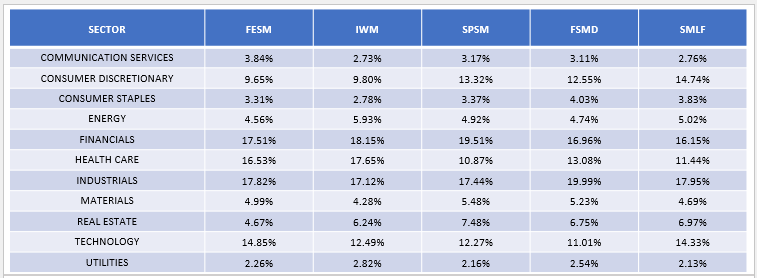
FESM and IWM are similar in terms of sector allocations, with the biggest difference being 2.36% more exposure to Technology stocks. However, both ETFs overweight Healthcare stocks. In particular, FESM and IWM have 9.50% and 9.22% allocated to the Biotechnology sub-industry compared to 2.12% for SPSM, reflecting how many of these stocks are not profitable.
The fund’s top ten holdings are listed below, totaling 7.89%. FESM also has 5.58% of assets on loan and 1.95% in cash. For my upcoming fundamental analysis, I’ve re-weighted the fund to only include common stock holdings, but I just wanted to highlight these allocations, as they are abnormally large.
Fidelity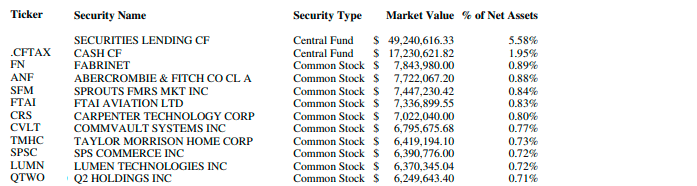
The concentration of assets in the top ten is low because FESM has 576 equity holdings. Still, the fund has only a 35.10% overlap with IWM and even less with SPSM, FSMD, and SMLF (28.42%, 19.00%, 20.55%).
FESM Fundamental Analysis
The following table highlights selected fundamental metrics for FESM’s top 25 sub-industries, totaling 61.78% of the portfolio. It’s slightly more concentrated than IWM (57.22%) and SPSM (53.88%), but its weighted average market cap and five-year beta figures are about the same.
The Sunday Investor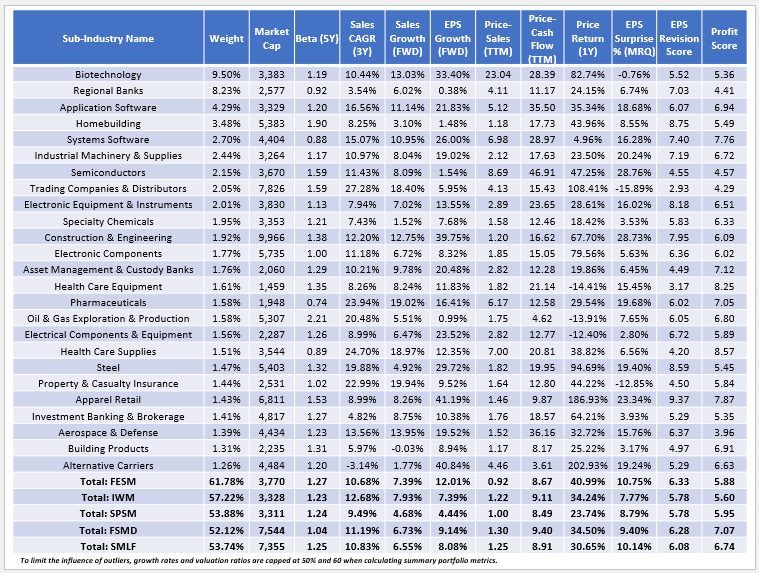
Here are two additional observations to consider:
1. FESM’s strategy, in part, is to “enhance” the Russell 2000 Index’s value and growth features, and this table indicates managers have done an excellent job on that front. FESM’s one-year estimated earnings per share growth rate of 12.01% is almost 5% better than IWM’s and almost 8% better than SPSM’s. Furthermore, it trades at just 0.92x trailing price and 8.67x trailing cash flow, both of which are competitive with IWM and at least competitive with SPSM.
2. FESM also seeks to enhance quality. However, based on its 5.88/10 sector-adjusted profit score, which I derived from Seeking Alpha Profitability Grades, the improvement is marginal and no better than what SPSM offers (5.95/10). Biotechnology (5.36/10) and Regional Banks (4.41/10) are drags on the portfolio’s quality, and notably, SPSM, FSMD, and SMLF allocate between 6-9% less to these sub-industries.
In addition, consider the following weighted average metrics that demonstrate how FESM actually is worse than IWM on several quality metrics. For example, its EBITDA margins are lower (12.61% vs. 15.27%), as are its net margins (4.36% vs. 5.25%). SPSM is superior across the board on all eight metrics listed, while FSMD and SMLF take quality up a level, primarily due to their larger weighted average market caps of about $7.5 billion.
The Sunday Investor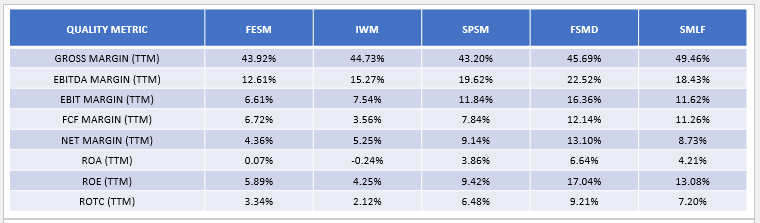
Depending on your circumstances, you might have little exposure to the small/mid-cap segment in the first place, in which case FSMD and SMLF would be efficient additions. I would explore this, as the quality is substantially better, and each has outperformed SPSM/IJR/VIOO with less volatility since March 2019, as follows:
Portfolio Visualizer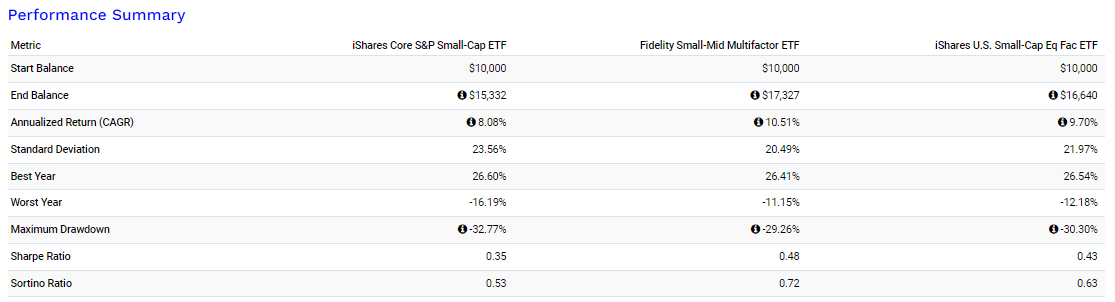
Investment Recommendation
FESM is fundamentally stronger than Russell 2000 Index ETFs like IWM. It also has a superior long-term track record on both returns and risk, so I’m confident it’s the better buy. In addition, FESM sports attractive growth and value metrics, but according to the fund’s prospectus, portfolio turnover has approached 100% in each of the last three years, so these features may not last long. Furthermore, FESM doesn’t emphasize quality, which could be why peers like SPSM, FSMD, and SMLF outperformed. Overall, I believe FESM deserves no more than a “hold” rating, and I encourage you to look closer at some of the small-cap ETFs mentioned in this article before taking a position. Thank you for reading, and I look forward to your comments below.