

Investors can buy gold ETFs to ride the gold price boom, but when it comes to these two physical gold ETFs, the choice is between size and cost.
The Goldman Sachs Physical Gold ETF (AAAU +0.14%) and the SPDR Gold Shares (GLD +0.09%) both offer direct exposure to physical gold. The two ETFs, however, differ in terms of cost, trading liquidity, and size, which is where investors need to weigh the two options before deciding where to invest.
Both AAAU and GLD are designed to reflect the price of gold bullion, minus expenses, and appeal to investors seeking a simple way to hold gold via the stock market. The comparison below looks at how the two ETFs stack up on fees, performance, risk, and what sets them apart for different investing needs.
Snapshot (cost & size)
| Metric | AAAU | GLD |
|---|---|---|
| Issuer | Goldman | SPDR |
| Expense ratio | 0.18% | 0.40% |
| 1-yr total return (as of Dec. 19, 2025) | 66.8% | 66.5% |
| Beta | 0.48 | 0.13 |
| AUM | $2.5 billion | $146.7 billion |
Beta measures price volatility relative to the S&P 500; beta is calculated from five-year weekly returns. The 1-yr return represents total return over the trailing 12 months.
Performance & risk comparison
| Metric | AAAU | GLD |
|---|---|---|
| Max drawdown (5 y) | -201.63% | -22% |
| Growth of $1,000 over 5 years | $2,287 | $2,262 |
What’s inside
GLD holds physical gold bullion. With over 21 years in operation, it is the oldest and largest gold ETF, managing $146.7 billion in assets as of Dec. 19, 2025. The ETF’s structure and size have made it a go-to option for investors seeking deep liquidity and tight bid-ask spreads.
AAAU also holds physical gold but is smaller in size, with $2.5 billion in assets under management. Both funds avoid leverage, derivatives, and added complexity, focusing on direct gold exposure.
For more guidance on ETF investing, check out the full guide at this link.
What this means for investors
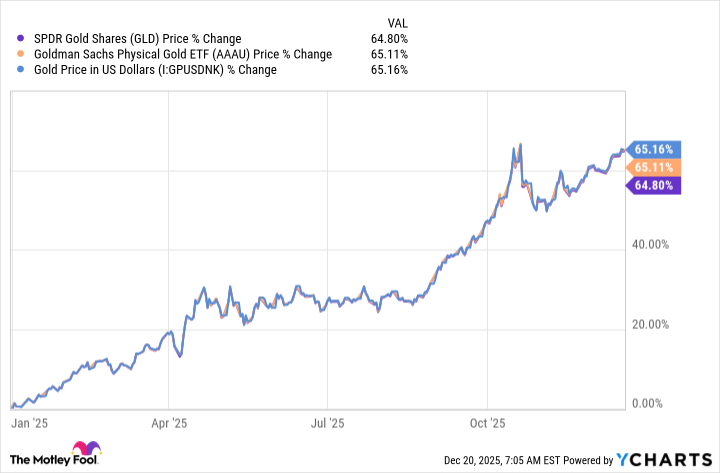
2025 has been a phenomenal year for gold, with prices of the precious metal surging nearly 65% and hitting all-time highs of $4,381.58 per ounce in October 2025. While geopolitical tensions make gold appealing as a safe-haven asset, interest rate cuts make it more luring as an investment as compared to bonds. Strong demand from central banks, especially from emerging markets, as they seek to diversify away from the U.S. dollar and build gold reserves, has further fueled gold prices in recent months.
Investors have been able to benefit from the gold boom by holding physical gold, investing in gold stocks, or gold ETFs. Among these, gold ETFs are often the preferred choice as they allow investors to gain exposure to gold prices without the hassles, costs, and risks of owning bullion and without the need to analyze individual stocks. Within ETFs, while some invest in the underlying commodity, others invest in a bunch of stocks.
The Goldman Sachs Physical Gold ETF and the SPDR Gold Shares are both physical gold ETFs, holding gold in secure vaults. Because these ETFs directly track gold prices, their performance closely mirrors gold prices. The difference mainly lies in size and cost.
AAAU is more affordable than GLD thanks to its lower 0.18% expense ratio, while GLD charges 0.40%. This fee difference may appeal to cost-conscious investors, especially those holding investments for the long term, as it can make a considerable difference to returns.
That’s because an expense ratio of 0.18% for AAAU means you pay only $1.80 in annual fees to the fund on a $1,000 investment. Comparatively, you pay an annual fee of $4 per year if you own shares of GLD. The larger size of GLD, meanwhile, may appeal more to traders as it means tighter bid-ask spreads because of higher liquidity and, therefore, lower transaction costs on bulk trades.
Glossary
ETF: Exchange-traded fund; a pooled investment security traded on stock exchanges, holding assets like stocks or commodities.
Expense ratio: Annual fee, expressed as a percentage of assets, that funds charge investors to cover operating costs.
Liquidity: How easily an asset or security can be bought or sold in the market without affecting its price.
Assets under management (AUM): The total market value of assets a fund or investment company manages on behalf of clients.
Bid-ask spread: The difference between the highest price a buyer is willing to pay and the lowest price a seller will accept.
Beta: A measure of an investment’s volatility compared to the overall market, often the S&P 500.
Max drawdown: The largest observed loss from a fund’s peak value to its lowest point over a specific period.
Physical gold bullion: Actual gold bars or coins held by a fund, rather than gold-related financial instruments or derivatives.
Direct exposure: When an investment directly tracks or holds the underlying asset, rather than using derivatives or proxies.
Total return: The investment’s price change plus all dividends and distributions, assuming those payouts are reinvested.
Sector labeling: Categorizing a fund’s holdings by industry or sector, sometimes inconsistently or due to data quirks.