

Compare how fund size, holdings, and portfolio breadth set VEA and SPDW ETFs apart for diversified investors.
The Vanguard FTSE Developed Markets ETF (VEA 0.51%) and the SPDR Portfolio Developed World ex-US ETF (SPDW 0.43%) ETFs are designed to provide broad, low-cost exposure to developed markets outside the United States, making them popular core holdings for international diversification. Both ETFs also charge the same low fee, but VEA is much larger, offers a slightly higher yield, and holds more companies in its portfolio.
The comparison below examines how VEA and SPDW compare in terms of cost, performance, risk, portfolio composition, and trading characteristics to help you make informed investing decisions.
Snapshot (cost & size)
| Metric | SPDW | VEA |
|---|---|---|
| Issuer | SPDR | Vanguard |
| Expense ratio | 0.03% | 0.03% |
| 1-yr total return (as of Dec. 30, 2025) | 35.2% | 35.9% |
| Dividend yield | 2.3% | NA |
| Beta | 1.03 | 1.06 |
| AUM | $33.5 billion | $260.0 billion |
Beta measures price volatility relative to the S&P 500; beta is calculated from five-year weekly returns. The 1-yr return represents total return over the trailing 12 months.
Both funds are equally affordable, with identical expense ratios, but SPDW offers better dividends while VEA has a much larger asset base, which could provide added liquidity and scale.
Performance & risk comparison
| Metric | SPDW | VEA |
|---|---|---|
| Max drawdown (5 y) | -30.23% | -29.71% |
| Growth of $1,000 over 5 years | $1,302 | $1,308 |
What’s inside
VEA tracks a broad FTSE index and includes 3,864 stocks, spanning large-, mid-, and small-cap developed markets outside the U.S., primarily Europe and the Pacific region. Its largest sector weights are in financial services, industrials, and technology, and its top holdings are ASML Holding (ASML 0.21%), Samsung Electronics, and AstraZeneca (AZN 0.63%). With an 18.4-year track record and no notable quirks, VEA offers wide diversification across regions and company sizes.
SPDW covers a similar developed-markets universe but with 2,390 holdings. Its top holdings, however, are similar to VEA and include ASML Holding, Samsung Electronics, and Roche Holding. The fund is also tilted a bit more towards Swiss multinationals, including Roche, Novartis (NVS 0.61%), and Nestle. It is heavily weighted towards financials and industrials sectors. Both funds follow straightforward, unhedged, market-cap-weighted strategies.
For more guidance on ETF investing, check out the full guide at this link.
What this means for investors
The Vanguard FTSE Developed Markets ETF and the SPDR Portfolio Developed World ex-US ETF offer near-identical low-cost ways to gain exposure to international markets. These ETFs are a great way to diversify your portfolio, act as a hedge against economic downturns in the U.S., and gain access to growth markets outside the U.S. The primary difference between the two ETFs lies in their portfolios and sizes.
VEA is nearly 8 times larger than SPDW and offers a wider coverage of international stocks with a strong focus on large-cap stocks. Its median market capitalization is $51 billion, while the SPDW’s median market cap stands at just around $768 million.
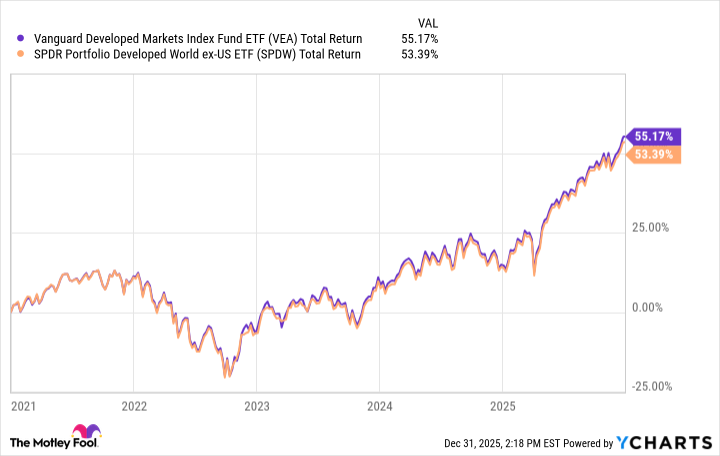
VEA Total Return Level data by YCharts
Over the past five years, both ETFs have experienced similar maximum drawdowns, indicating that investing in these ETFs carries similar risks and volatility. VEA posted a slightly higher cumulative growth, or total return, of 55.2% compared to SPDW’s 53.4% return. That’s not much of a difference, though; and going by their major holdings and similar expense ratios, both ETFs will likely generate similar returns in the long term. You could buy either of the two, or some shares of both, to diversify your investments.
Glossary
ETF: Exchange-traded fund; a pooled investment that trades on stock exchanges like a single stock.
Expense ratio: The annual fee, as a percentage of assets, that a fund charges to cover operating costs.
Dividend yield: Annual dividends paid by a fund or stock divided by its current price, expressed as a percentage.
Beta: A measure of an investment’s volatility compared to the overall market, typically the S&P 500.
AUM: Assets Under Management; the total market value of assets a fund manages for investors.
Max drawdown: The largest percentage drop from a fund’s peak value to its lowest point over a specific period.
Market-cap-weighted: A strategy where holdings are sized based on each company’s total market value relative to the index.
Developed markets: Countries with advanced economies and established financial systems, such as Japan, UK, and Western Europe.
Liquidity: How easily an asset can be bought or sold in the market without affecting its price.
Unhedged: An investment approach that does not protect against currency fluctuations between countries.
Sector allocation: The distribution of a fund’s investments across different industries, such as technology or healthcare.
Cumulative growth: The total percentage increase in value of an investment over a set period, including reinvested returns.