

Solana price hovered above $100 as crypto ETFs attracted $1.3 billion in inflows last week. The broader crypto market fell 0.79% to $2.63 trillion, reflecting cautious sentiment.
Bitcoin traded near $77,000, while Ethereum held around $2,478 and XRP price remained above $1.40.
Today’s CLARITY Act procedural vote needs 60 Senate votes to advance debate. Republicans require at least seven Democratic or independent votes if all 53 party senators support the motion.


Crypto ETF Inflows Hit $1.3B as Winning Streak Reaches Six Weeks
The Crypto ETFs had a record of $1.3 billion inflows in a week, and this was a continuity of their streak of six consecutive weeks. Total inflows amounted to $6.8 billion and BlackRock IBIT alone raised $3.4 billion.
BREAKING: Crypto ETFs attracted +$1.3 billion in inflows last week, following +$3.3 billion in the week prior.
This also marks their 6th consecutive weekly inflow.
Over this period, these funds have posted +$6.8 billion in inflows.
The largest Bitcoin ETF, $IBIT, alone… pic.twitter.com/HkXvyCMulB
— The Kobeissi Letter (@KobeissiLetter) September 15, 2026
The four-week average reached a high of $1.5 billion, the first time since November 2025. Four outflow sessions of over $463 million were witnessed on Monday, providing $160 million to spot Bitcoin ETFs. The Spot Ether ETF raised $121million, which underscores the revived interest in cryptocurrency investment products.


Solana ETF Inflows Hit $11M as Bitwise Leads Daily Demand
On September 14, Solana exchange-traded funds registered net inflows of $11.01 million per day, as per SoSoValue. Cumulative inflows amounted to $1.37 billion and combined net assets increased to 1.46 billion.
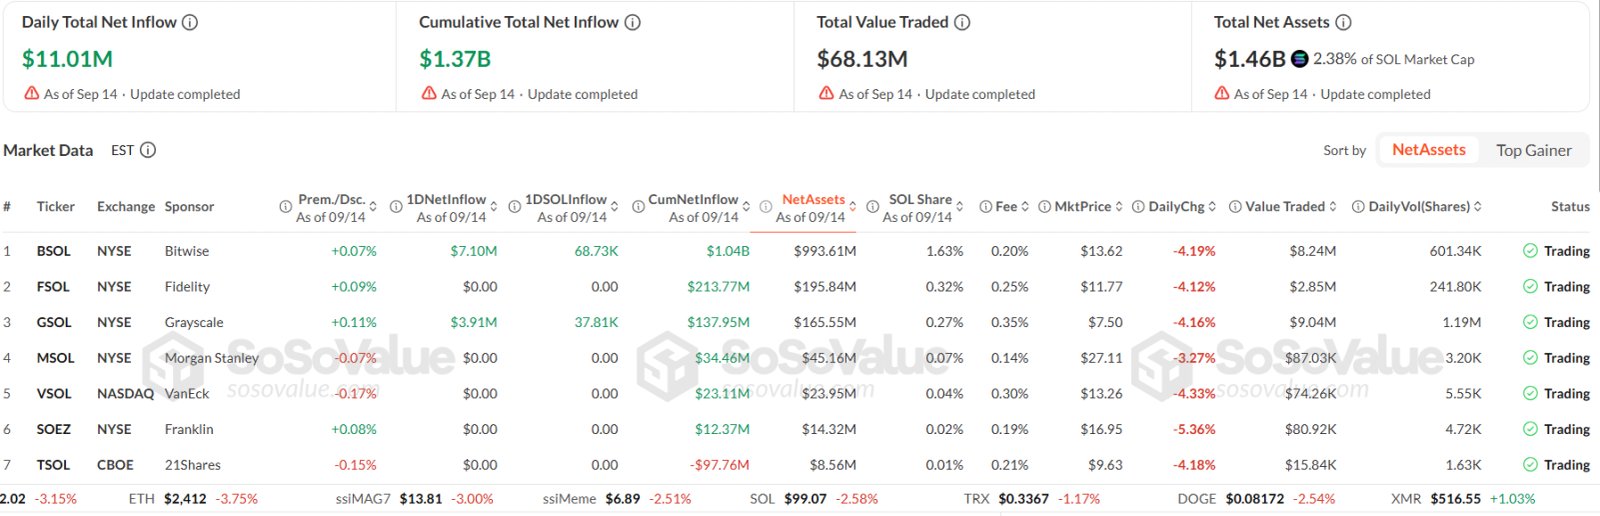
The BSOL by Bitwise topped the demand at $7.10 million and GSOL at Grayscale at 3.91 million. The total trading value was at 68.13 million, which shows institutional subsistence in Solana-linked funds. The assets represented by the products were all 2.38% of the market capitalization of Solana.
SOL Price Holds $100 Support as Bulls Target $110 Breakout
The SOL Price traded at $100.86 on September 15, sitting directly above the four-hour chart’s key $100 support.
The Relative Strength Index is 39, which is lower than the midpoint. The weak demand is an indication of this reading, but SOL has not hit the oversold arena.
The MACD histogram is just positive 0.01. In the meantime, the two underlying lines are close to -0.11.
Bulls require a solid close of at least four hours above $110 to reassure of new strength. The next marked resistance zone on the chart is equal to $120, which could be the target of that breakout.
Nevertheless, SOL needs to break the selling pressure near recent swing highs first. The Solana long-term prediction might continue to fluctuate within its current range as long as it continues to be rejected below $110.
The inability to hold $100 would undermine the structure and reveal a new downside target of $95. Buyers can defend $95 as that was the level that justified the late-August improvement.
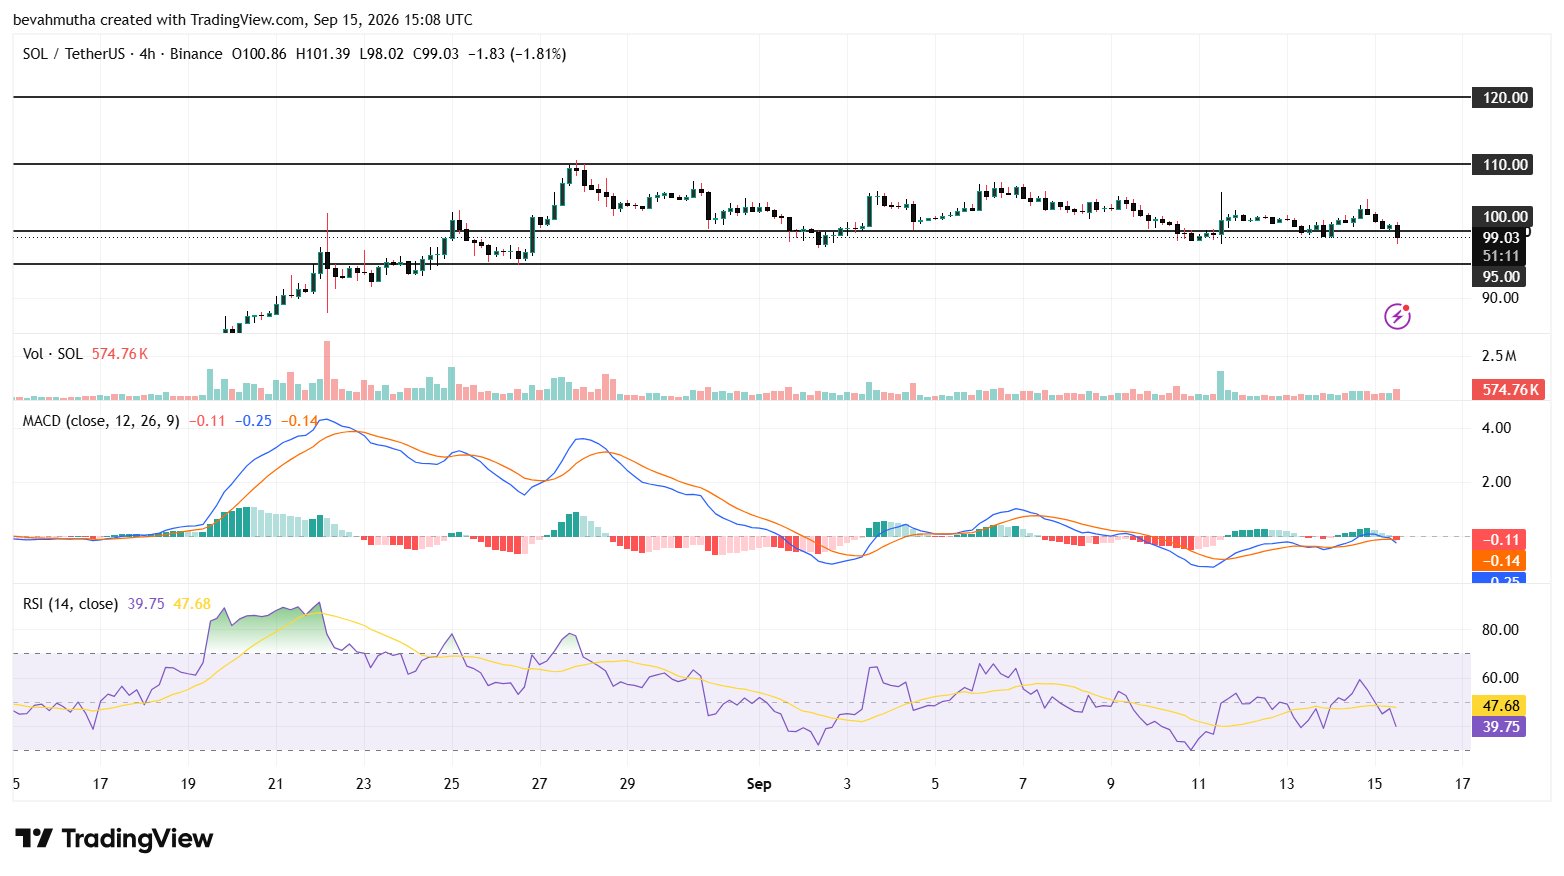
A four-hour close below $95 may indicate a further correction than shown on the chart support levels. On the other hand, keeping $100 would leave the possibility of making another recovery effort for Solana price.