
")
designer491
Strategy
iShares Broad USD High Yield Corporate Bond ETF (BATS:USHY) started investing operations on 10/25/2017 and tracks the ICE BofA US High Yield Constrained Index. It has 1874 holdings, a 12-month trailing yield of 6.71%, a 30-day SEC yield of 7.56% and an expense ratio of 0.08%. Distributions are paid monthly. Based on assets under management, USHY is the largest ETF in high yield corporate bonds (often referred to as “junk bonds”), shortly ahead of iShares iBoxx $ High Yield Corporate Bond ETF (HYG) and SPDR Bloomberg High Yield Bond ETF (JNK).
As described by iShares in the prospectus,
The Underlying Index is designed to provide a broad representation of the U.S. dollar-denominated high yield corporate bond market. The Underlying Index is a modified market value-weighted index with a cap on each issuer of 2%.
Eligible securities must have at least $250 million of outstanding face value, an original maturity date of at least 18 months and at least one year to maturity. Issuers must have an average rating below investment grade and be headquartered in a list of 28 developed countries. The portfolio turnover rate in the most recent fiscal year was 13%.
Portfolio
The heaviest sectors in the portfolio are consumer discretionary and industrials, almost on par at about 20% of asset value. Communication, energy, and consumer staples are between 12% and 14%. Other sectors are below 10%.
Sector breakdown in % (Chart: author; data: iShares)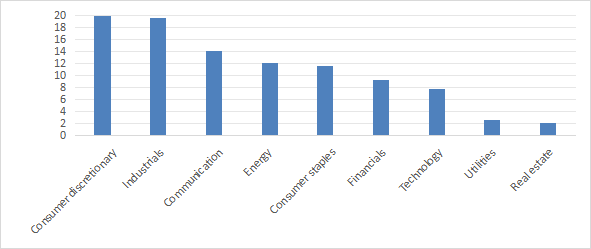
About 50% of asset value is invested in debt with a BB rating, meaning the fund has a tilt to less risky junk bonds (the upper rating BBB is investment grade).
Quality breakdown in % (Chart: author; data: iShares)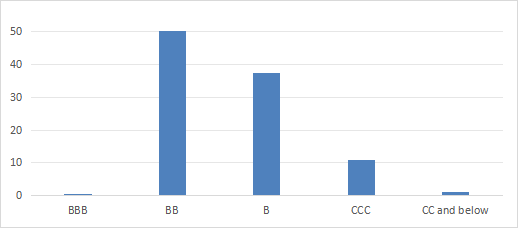
About 51% of assets have maturity of between 3 and 5 years. The portfolio’s weighted average maturity is 4.36 years.
Maturity breakdown in % (Chart: author; data: iShares)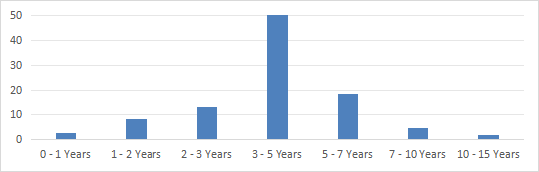
The next table lists the top 10 issuers, which represent 9.5% of asset value. The portfolio is well-diversified and risks related to individual companies are low.
|
Name |
Common stock |
Weight% |
|
CCO HOLDINGS LLC |
1.93 |
|
|
TRANSDIGM INC |
1.14 |
|
|
TENET HEALTHCARE CORPORATION |
0.94 |
|
|
VENTURE GLOBAL LNG INC |
0.93 |
|
|
CHS/COMMUNITY HEALTH SYSTEMS INC |
0.82 |
|
|
CSC HOLDINGS LLC |
0.79 |
|
|
CLOUD SOFTWARE GROUP INC |
0.77 |
|
|
CARNIVAL CORP |
0.77 |
|
|
ROYAL CARIBBEAN CRUISES LTD |
0.71 |
|
|
MEDLINE BORROWER LP |
0.65 |
Performance
USHY has a total return close to 31% since its inception in October 2017:
USHY total return (Seeking Alpha)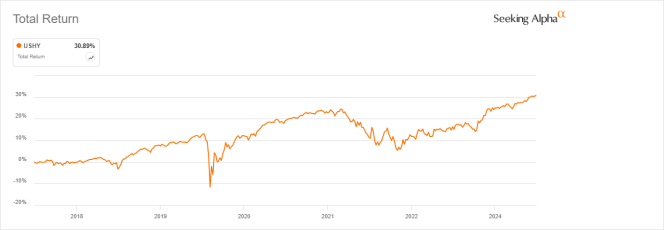
However, the share price has lost 12% (excluding distributions). While it has been paying high distributions, the fund has suffered a loss in capital. The decay is amplified by the cumulative inflation: about 27% since November 2017, based on the Consumer Price Index.
USHY price return (Seeking Alpha)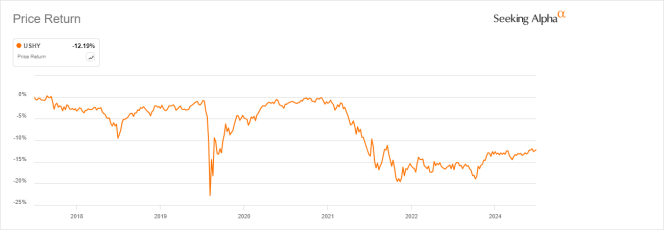
The annual sum of distributions was close to flat from 2018 to 2023, as reported on the next chart. Measured in inflation-adjusted value, it represents a loss of income stream over 20% in 5 years for shareholders.
USHY distribution history (Seeking Alpha)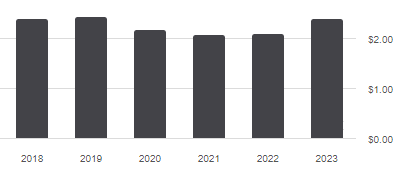
The next table compares characteristics of HYG and its closest competitors HYG and JNK, both passively managed ETFs tracking different indexes in the same asset category.
|
USHY |
HYG |
JNK |
|
|
Inception |
10/25/2017 |
4/4/2007 |
11/28/2007 |
|
Expense Ratio |
0.08% |
0.49% |
0.40% |
|
AUM |
$15.93B |
$15.25B |
$8.17B |
|
Avg Daily Volume |
$282.91M |
$2.77B |
$325.43M |
|
Turnover |
13.00% |
11.00% |
28.00% |
|
Div. Yield TTM |
6.78% |
5.92% |
6.62% |
|
Div. Growth 5 Yr CAGR |
-0.15% |
-0.06% |
0.57% |
USHY is the largest of these funds in assets and has the cheapest expense ratio. It is the least liquid in dollar volume, though. The next chart plots total returns, starting on 11/1/2017 to match all inception dates. USHY is the best performer, while HYG and JNK are almost tied.
USHY vs HYG, JNK (Seeking Alpha)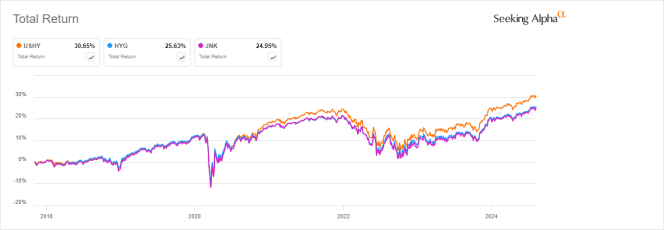
USHY vs. strategy ETFs
The next table compares characteristics of USHY and five high-yield corporate bond ETFs intending to improve the risk-adjusted performance with specific rules:
- iShares 0-5 Year High Yield Corporate Bond ETF (SHYG)
- VanEck Fallen Angel High Yield Bond ETF (ANGL)
- First Trust Tactical High Yield ETF (HYLS)
- FlexShares High Yield Value-Scored Bond Index Fund (HYGV)
- Invesco Fundamental High Yield Corporate Bond ETF (PHB).
|
USHY |
SHYG |
ANGL |
HYLS |
HYGV |
PHB |
|
|
Inception |
10/25/2017 |
10/15/2013 |
4/10/2012 |
2/25/2013 |
7/17/2018 |
11/15/2007 |
|
Expense Ratio |
0.08% |
0.30% |
0.25% |
1.02% |
0.37% |
0.50% |
|
AUM |
$15.93B |
$6.18B |
$2.96B |
$1.44B |
$1.39B |
$645.20M |
|
Avg Daily Volume |
$282.91M |
$56.52M |
$34.67M |
$6.52M |
$8.78M |
$2.64M |
|
Holdings |
1874 |
1052 |
127 |
332 |
1003 |
239 |
|
Turnover |
13.00% |
26.00% |
31.00% |
29.00% |
167.00% |
31.00% |
|
Div. Yield TTM |
6.78% |
6.64% |
5.94% |
6.38% |
8.77% |
5.33% |
|
Div. Growth 5 Yr CAGR |
-0.15% |
1.43% |
1.09% |
-0.15% |
-4.52% |
4.17% |
Once again, USHY has the lowest expense ratio. The next chart plots total returns, starting on 7/23/2018 to match all inception dates. USHY is the second-best performer, significantly lagging the “fallen angels” fund, which invests in debt of companies that lost their investment grade rating.
USHY vs. Competitors since 7/23/2018 (Seeking Alpha)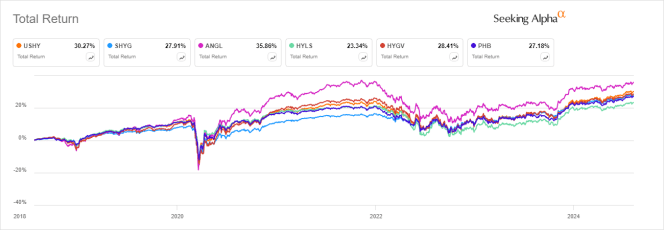
Takeaway
iShares Broad USD High Yield Corporate Bond ETF is the largest “junk bond” ETF. USHY has an attractive yield, but its price has lost 12% since 2017 and distributions have not kept pace with inflation. Nonetheless, USHY has performed quite well compared to competitors and has a lower fee. However, it has been lagging fallen angel ETFs like VanEck Fallen Angel High Yield Bond ETF (ANGL) and iShares Fallen Angels USD Bond ETF (FALN). High-yield bond ETFs don’t look very compelling as long-term investments, but they may be very useful in tactical asset allocation strategies switching between bond categories.
Editor’s Note: This article discusses one or more securities that do not trade on a major U.S. exchange. Please be aware of the risks associated with these stocks.