ilkercelik/E+ via Getty Images
While a number of quality ETFs have relatively concentrated portfolios, the Vanguard U.S. Quality Factor ETF (BATS:VFQY) takes a more diversified bias, with allocations more evenly distributed across different market cap categories.
With a portfolio tilting toward defensive sectors and is underweight in technology, VFQY somewhat resembles a value fund, as reflected in its low price/earnings ratio of 16.8x. However, this more conservative approach has resulted in VFQY’s performance lagging the broader market and other quality ETFs over time, while volatility measures have been higher than expected for a quality fund.
This is certainly not a compelling setup for a fund that seeks to outperform the market. On the other hand, looking ahead, it will be interesting to monitor how the fund performs in a shifting environment for stocks with lower rates and a mixed macroeconomic outlook.
ETF Description & Highlights
VFQY is an exchange-traded fund managed by Vanguard that aims to achieve long-term capital appreciation by investing in U.S. companies with strong fundamentals and the potential to deliver higher returns relative to the broader market.
Starting with a universe of small, mid, and large-capitalization companies, a quantitative model is applied to identify companies that exhibit strong profitability, sustainable earnings and healthy balance sheets. A quality factor is assigned to each company, comprising return on equity, gross profitability, change in net operating assets and leverage. However, for financial companies, given the particularity of their operations, the quality factor is calculated only by return on equity and share issuance instead. This quality score will be considered for stock selection and the weighting process in combination with companies’ market capitalization, alongside a set of constraints to improve portfolio diversification and liquidity.
The result is a portfolio with 364 constituents as of June 30, 2024, an average market cap of $26.94 billion, and a well-diversified allocation across market cap categories. VFQY’s allocation to large and mega caps represents only 36% of total assets, while this proportion reaches nearly 72% in the Russell 3000 index, the benchmark for this fund adopted by Vanguard. On the flip side, micro and small caps account for 25% of VFQY’s total assets, in contrast to nearly 8% in the Russell 3000 index.
VFQY’s top ten holdings (Apple (AAPL), Gilead (GILD), Qualcomm (QCOM), 3M (MMM), Adobe (ADBE), Walmart (WMT), TJX (TJX), KLA (KLAC), IDEXX (IDXX), and Lam Research (LRCX)) make up 18% of total assets, with Apple, the top holding, representing only 2.2% of the fund, indicating a strong bias toward diversification, although there is a notable participation of technology companies, with six names among the top 10 holdings.
Morningstar, consolidated by the author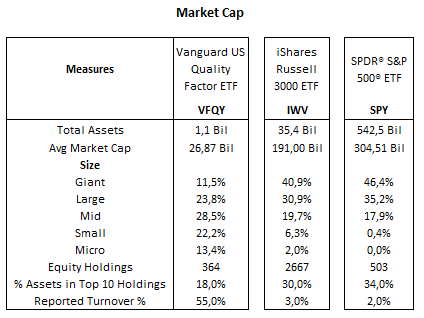
Below is a table that compares VFQY with a peer group of quality ETFs. The first three are the largest funds in the segment, where QUAL and FQAL are biased toward large companies. The next one, TTAC, is also an established fund, with its inception in 2016 and greater exposure to smaller capitalization companies like VFQY. The last two, ROE and QLTY, are new funds that started in 2023, where ROE is equally weighted, and QLTY has a high conviction approach, with only 34 holdings.
Morningstar, consolidated by the author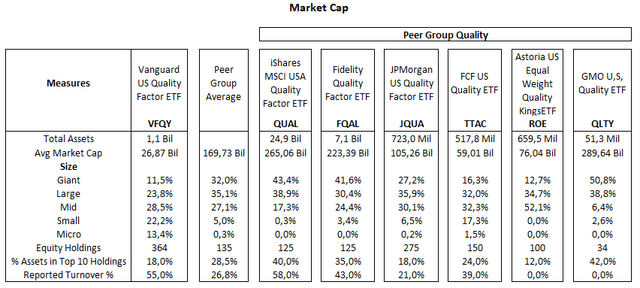
From a sector allocation perspective, VFQY‘s largest allocation is to the technology sector, with 19.9% of total equities. This is followed by industrials at 18.3%. Financial services and consumer cyclical sectors each account for 16.0% of the portfolio. Healthcare comprises 11.0%, consumer defensive stocks 10.7%, basic materials and energy sectors are relatively smaller allocations at 3.1% and 2.8%, respectively, and communication services hold 2.4%.
When compared to the Russell 3000 index, VFQY has a lower allocation to technology (-9.8%) and communication services (-6.1%), as VFQY has no positions in mega caps such as Microsoft (MSFT) and Broadcom (AVGO) and holds only marginal investments in Alphabet (GOOG) (GOOGL) and Meta (META). Meanwhile, VFQY has higher allocations to industrials (+9.2%), consumer cyclical (+6.0%) and consumer defensive (+4.9%), boosted by selected allocations in consumers like Walmart, TJX, and Nike (NKE), among others, and industrials such as 3M, Cintas (CTAS), and Fastenal (FAST).
Morningstar, consolidated by the author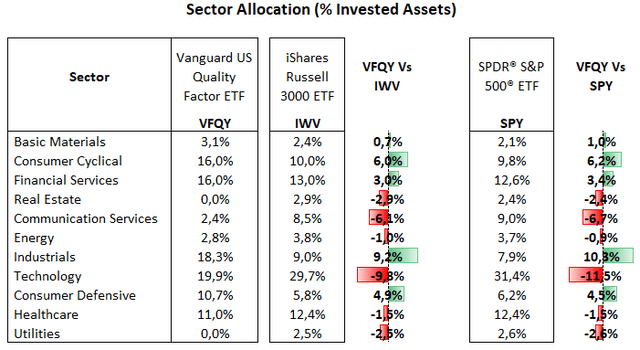
A comparison with the peer group of quality ETFs also shows VFQY overweight in the industrial and consumer sectors but underweight primarily in technology and communication services. This is an indication of VFQY’s selective approach to more stable businesses rather than growth players, where profitability measures may not be as high, such as those of some semiconductors or software makers. However, there are exceptions, such as Microsoft and Netflix (NFLX), which are fairly profitable businesses but are not included in VFQY’s portfolio.
Morningstar, consolidated by the author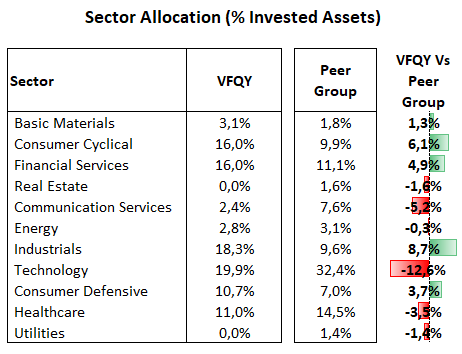
VFQY’s bias toward more defensive areas, with underweight exposure to big tech companies, including semiconductors, Amazon (AMZN), and mainly Tesla (TSLA), has lowered its average price/earnings ratio to 16.8x, compared to 21.8x for the Russell 3000 index, despite a few overweight allocations in consumer stocks, such as Walmart and Costco (COST), which trade well above the 25x level.
This positions VFQY as a value fund in comparison with the other quality ETFs, as the peer group’s average price/earnings ratio of 21.5x is nearly the same as the broader market, since those funds remain heavily allocated to technology and communication services. On the flip side, VFQY shows relatively lower growth measures compared to the stock indexes and particularly to the peer group of quality ETFs, as all of them show earnings growth in the high single-digit to mid-double-digit range, with the lowest readings seen in JQUA, where historical earnings growth is at 7.6%.
Morningstar, consolidated by the author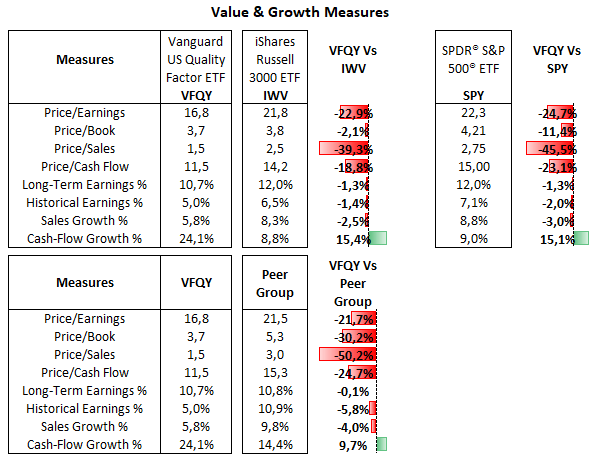
Lagging Behind the Broader Market
VFQY has consistently underperformed the broader market since its inception, with the only exception of the years 2021 and 2022, when the stock market faced a strong correction led by higher interest rates. In contrast, the peer group of quality ETFs has outpaced the Russell 3000 index but lagged the S&P 500 index by a small margin.
The same applies to the volatility measures, as VFQY shows higher beta and standard deviation relative to the benchmarks, while the peer group has been less volatile, with a beta of nearly 0.97, which is more reasonable for a portfolio with a quality bias.
Morningstar, consolidated by the author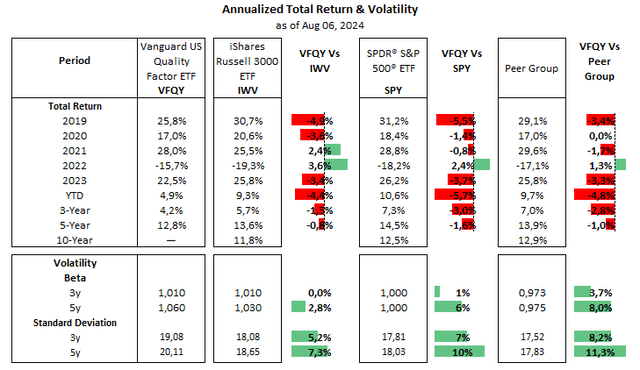
That said, while much of VFQY’s underperformance reflects a primary allocation away from mega-cap stocks and the technology sector, it is counterintuitive to see this fund with higher volatility than the broader market.
In summary, despite attractive valuations and an interesting model for screening stocks based on recognized quality metrics such as ROE and gross profitability, this fund is not the best choice for investors looking to add exposure to stocks, as expectations for an investment with a quality approach include stability and higher returns on a relative basis, attributes that VFQY has not been able to deliver so far.

