
")
William_Potter
Introduction
The Vanguard FTSE Emerging Markets ETF (NYSEARCA:VWO) with over $100bn in total AUM, is the largest and one of the most cost-efficient ETFs (expense ratio of just 0.08%) that offers diversified access to mainly large and mid-cap emerging market (EM) stocks (the small-cap component is less than 4%).
Over the past year, this ETF, which focuses on over 5800 stocks from 24 different emerging markets, has failed to dazzle, generating positive returns of only mid-single digits, even as global markets have delivered returns that are 2.2x better.
YCharts
VWO may have experienced a middling twelve months, but could the trend shift in the months ahead?
Key Macro Considerations
VWO may offer exposure to stocks from around two dozen emerging markets, but at the end of the day, most of the stocks (51% of the total portfolio) come from two EMs in particular – China, which contributes 27% of the total holdings, and India, which contributes 24% of the holdings.
Those who’ve had the opportunity to go through the IMF’s most recent World Economic Outlook Report (it gets updated on a quarterly basis, and the most recent numbers came out in July) would be enthused to note that both these regions played an instrumental part in the lifting of the agency’s expected real GDP growth for EMs as a whole (relative to what was forecasted back in April).
IMF July 2024 Outlook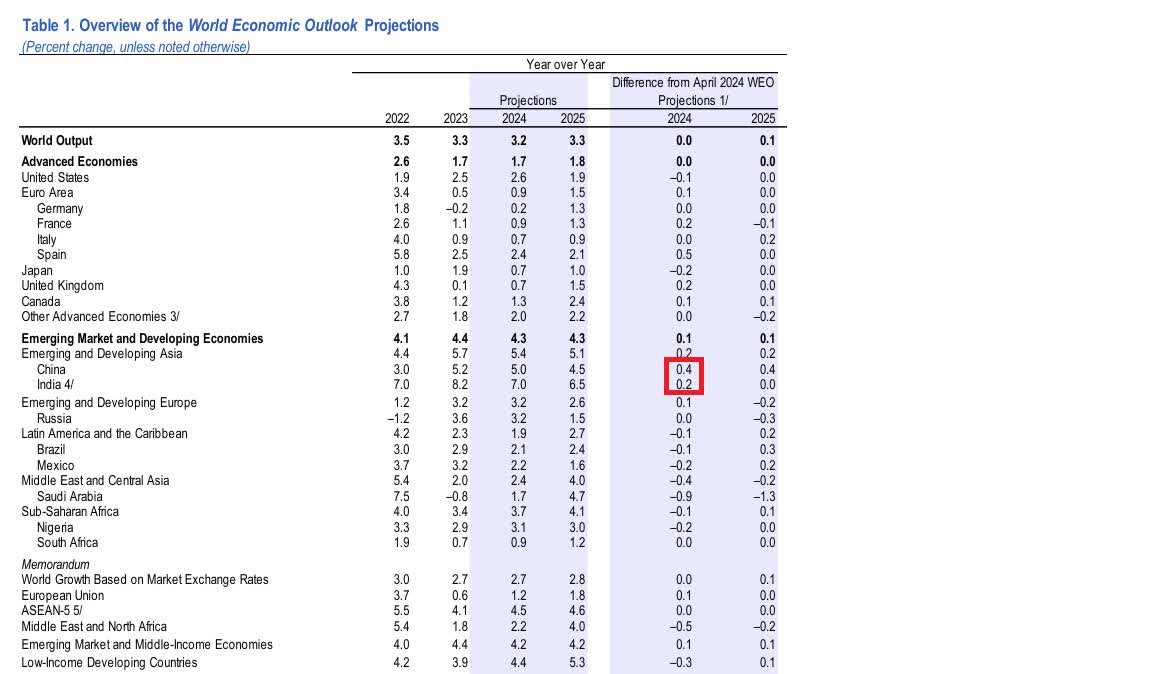
The key catalyst here was China, receiving a 0.4% bump in its expected real GDP for the whole year. Whilst that was no doubt quite encouraging, part of the Chinese revisions was also driven by a pickup in export momentum, which came in better than what the IMF was expecting.
However, investors should note that export trends in recent months haven’t quite been able to keep up. In fact, export data for the month of July which came out a couple of days back, came in below street estimates at only 7% (expected growth of 10%), and lower than the 8.6% level seen in June. Now, given relatively easier comparisons through much of H2-24, we don’t necessarily see YoY export numbers falling off a cliff, but it may not necessarily be as resilient as initially perceived.
Reuters
The IMF’s revisions were also in part driven by better private consumption conditions, and even though things are not at full tilt here, we believe the impact of potential policy measures should start abetting this segment.
In late July, the Communist Party carried out a Politburo meeting, and quite unlike the typical trend of voicing measures to boost the infrastructure segment of the economy, the big takeaway this time was the impetus towards boosting household consumption. The Politburo now intends to bring through some countercyclical measures, as well as further fiscal and monetary measures that could ramp up consumer spending.
When it comes to China’s neighbor India, we feel a lot more sanguine about its prospects. After a volatile few months surrounding the Lok Sabha elections, the economy can now continue to benefit from more political stability. Previously, in Q1, there were some concerns over rural consumption failing to get going, but relatively strong southwest monsoons are expected to boost reservoir levels, which in turn could do a world of good for the prospect of Kharif crops. All this bodes well for rural income in India, which is a key catalyst for consumption momentum in India. Even without the impact of the monsoon, it’s worth noting that, rural consumption trends in Q2 appear to be in a good way.
Meanwhile, EM bulls will also take heart from the fact that the dollar index has now slumped to its lowest level in 7 months. The weak employment data from last week has raised the prospects of more rate cuts by the US Fed this year, dampening the allure of the dollar. Previously traders were only expecting 25bps of cuts in the September meeting, but now there is a 70% probability that we could get 50bps shaved off in the same meeting, with 110bps of easing expected for the whole year.
Closing Thoughts – Technical and Valuation Commentary
The macro narratives surrounding VWO may not be entirely resilient, but if we switch over to the technical and valuation backdrop, VWO doesn’t look like a bad bet at this juncture.
YCharts
The relative strength charts of global stocks (the proxy here is the Vanguard Total World Stock ETF) can be a useful tool in identifying some of the most oversold equity regions in the world that offer scope for mean-reversion. In that regard, the chart above measures how overextended things look for EM stocks, as their current relative strength ratio versus global stocks is at record lows and offers some scope for reverting closer to its mean which is around 71% higher.
VWO’s portfolio of EM stocks are further boosted by a favorable valuation backdrop, where they are priced at a P/E of only 13.3x, and yet offer long-term earnings potential within a similar figure. Contrast that with global stocks which are only poised to deliver a little over 11% earnings on a long-term basis, but are yet priced at a steep P/E of close to 18x!
Investing
In addition to that, if we look at VWO’s weekly price imprints, in the context of a two-year time frame, we think the risk-reward now for a long position now doesn’t look too shabby. Essentially, note that VWO has been moving up within a certain ascending channel, marked by two black lines. Buying the ETF when it drops closer to the lower boundary, and selling it as it hits the upper boundary, seems to have worked quite well. Currently, there’s still some scope for VWO to drop further to its lower boundary (which would represent an ideal zone to buy), but even at current levels, the differential versus the lower boundary vis-à-vis the upper boundary points to fairly decent risk-reward.