
-
Learn how to build customized exchange-traded fund (ETF) and mutual fund views using the data fields in My Portfolio -
Discover how to track performance, fees, risk and fund characteristics with metrics tailored to your investing goals -
Understand how to organize holdings by asset type and edit custom views
We’ve added a new feature to My Portfolio that will help you better track the exchange-traded funds (ETFs) and mutual funds you own. You can now create a custom view from more than 200 data fields. This allows you to select the data that matters most to you as opposed to having to rely on your broker or fund company’s default view.
This new feature is available to all AAII members. The custom view complements the A+ Investor Grades already available in My Portfolio.
We have also added the ability to group your portfolio view by asset type. This separates your My Portfolio view into as many as four segments: stocks, ETFs, mutual funds, and cash and bonds. You still have the ability to view your portfolio as a single table, if you prefer.
In this article, I walk you through the process of creating a custom fund view using the criteria you see displayed in AAII Journal articles on ETFs and mutual funds.
Create a Portfolio in My Portfolio
The first step is to create a portfolio in My Portfolio, which is located in the AAII Investor Hub. If you haven’t joined the many AAII members who already use My Portfolio, it is very easy to get started. To set up a portfolio, just go to My Portfolio and click on the Create Portfolio button. You can either enter ticker symbols directly, upload a spreadsheet saved in the CSV file format, or sync to your broker and/or mutual fund account.
Broker and mutual fund integration is provided via the Plaid network. Plaid is a widely used application in the financial industry. It provides just your portfolio holdings in the accounts you choose in a read-only format. AAII cannot alter or edit your brokerage holdings. (Go to Help & Support in the Investor Hub for more details on brokerage security with Plaid.)
Create a Custom View
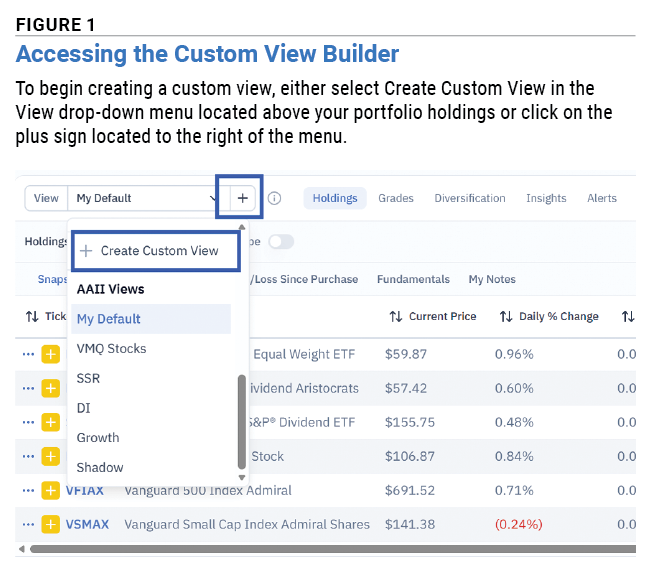
In My Portfolio, open the portfolio you want to create a custom view for. Then, either select Create Custom View from the View drop-down menu located above your portfolio holdings or click on the plus sign located to the right of the menu (Figure 1).
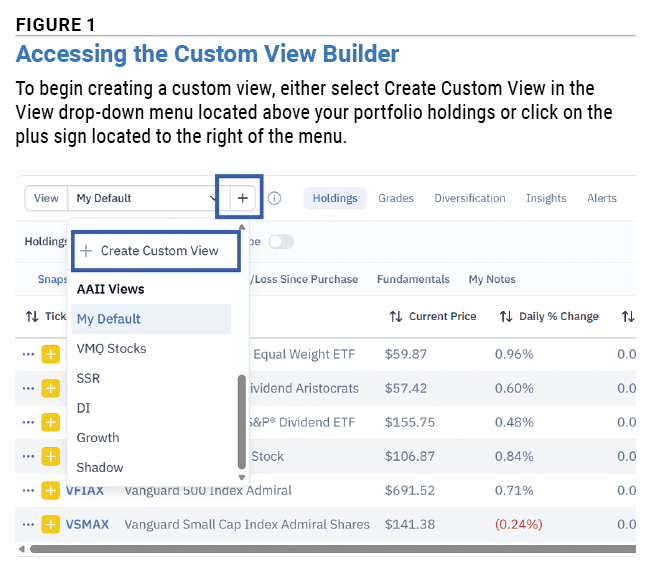
The Custom View Builder window that pops up groups the data fields by category: AAII Grades, Funds and SI Pro. The Funds category lists the data fields you can use to build your custom fund view (Figure 2). The SI Pro category shows the data fields available for stocks.
A data field is added to a view by clicking on it. Basic and lifetime AAII members can choose up to 10 data fields; A+ Investor and AAII Platinum subscribers can choose many more.
Add Performance Metrics
Start creating your view by adding performance metrics. For the fund tables in the AAII Journal, we show returns for the current year as well as annualized returns.
Calendar-year returns, including year-to-date performance, are located by selecting Annual Returns from the menu on the left-hand side of the Custom View Builder pop-up window. To model your custom view after the ones used for AAII Journal articles, open the Annual Returns (NAV) Total Returns drop-down menu and select 2026 Return (NAV).
Then, open the Returns (NAV) Grades drop-down menu and select 2026 Grade (NAV). This adds the year-to-date grade based on the net asset value (NAV) return to your view. The performance grades are based on returns relative to a fund’s peers. Grades of A are assigned to funds whose returns rank in the highest 20% of their category. Grades of F are assigned to funds whose returns rank in the lowest 20% of their category.
Trailing, or annualized, returns are accessible by selecting Trailing Returns from the left-hand menu. Then, open the Returns (NAV) Total Returns drop-down menu. To model your view after the ones used for AAII Journal articles, add the three- and five-year annualized (“Ann’l”) NAV returns.
The corresponding grades for those annualized returns can be found under the Returns (NAV) Grades drop-down menu. Add the three- and five-year annualized NAV return grades.
You may notice that your options include NAV and price returns. NAV returns include the change in net asset value over the selected time period and assume a reinvestment of all income and capital gains distributions. Price returns are based on changes in market prices and assume a reinvestment of all income and capital gains distributions. Mutual funds only have NAV returns, while ETFs have both NAV and price returns. This is because ETFs are bought and sold throughout the trading day, whereas mutual funds are only bought and sold based on their end-of-day net asset value.
Add ETF and Mutual Fund Characteristics
Let’s go back to the left-hand menu and select Characteristics under the Funds category. All other ETF and mutual fund quantitative traits are located in this category. These include portfolio composition, fees, distributions and risk measures.
Within the Characteristics section, open the Portfolio drop-down menu—the first option on the list. Then, click on Yield, which is located at the bottom of the Portfolio options.
In addition to yield, we regularly show a fund’s expense ratio in the AAII Journal tables. This field is located under Cost & Fees. The Expense Ratio Grade field is added to provide context for whether a fund’s expense ratio is low (grade of A or B) or high (grade of D or F).
If the tax-cost ratio matters to you, add it to your view from the Cost & Fees drop-down menu as well. Just click on Tax-Cost Ratio.
Finally, open the Risk & Volatility drop-down menu and click on Risk Category. This measure tells you if an ETF or mutual fund has been more (value above 1.00) or less (value below 1.00) volatile than its peers.
Finalize Your View
Take a moment to type in a name for your customized fund view in the box located at the bottom of the pop-up window. Then, select the Save View button. The pop-up window will close, and you will see a list of your custom views.
To adjust the order in which the data fields appear or to change one or more criteria, click on the pencil icon located to the right of the view’s name. The Custom View Builder pop-up window will open again for editing.
Any data field included in your custom view can be moved via the Selected section on the right-hand side of the builder pop-up window. Simply click and hold on the dots just to the left of the data field’s name and drag it up (which moves it further to the left side of the view table) or down (moving it further to the right). You can also remove a data field from your view by clicking on the “x” located to the right of each selected data field.
Once you are done making adjustments, select the Update View button to save your changes.
View the Data Online or Offline
After you have created your view, My Portfolio gives you options for how you view it. You can access it directly in the Investor Hub on AAII.com. You can also download the Investor Hub app to the device of your choice, including iOS and Android phones and tablets. Alternatively, you can export the data to a spreadsheet. All three options are included in your membership.
A+ Investor and AAII Platinum subscribers can add more than 10 fields to a custom view, along with A+ Investor stock grades, portfolio diversification analysis and portfolio-specific insights.


