

Portfolio Management Services (PMSes) offering debt strategies occupy a niche segment where bespoke fixed-income investing meets high-net-worth wealth management. With a minimum investment threshold of ₹50 lakh, these debt PMS strategies provide tailored solutions for high risk profile corporate treasuries, family offices and ultra-HNIs.
Structure
Discretionary debt PMS strategies are typically open-ended, offering flexibility for investors to enter or exit, though many impose exit loads. These portfolios are highly personalised—investors discuss their goals, risk appetite and return expectations before allocations are designed. Each client maintains a separate account, ensuring transparency and asset segregation. PMS managers structure portfolios as per investor preferences, either growth-oriented or income-distribution focused. For example, Phillip Income Builder Portfolio – Growth aims for capital appreciation, while Phillip Income Builder Portfolio – Regular Income offers periodic payouts.
Since investments are held in the client’s name, interest income and are taxed directly in the investor’s hands.
According to the PMS industry body, the Association of Portfolio Managers in India (APMI), there are currently 169 discretionary debt PMS strategies managing assets worth ₹40,351 crore, as of September 2025.
Investment process
SEBI mandates that discretionary debt PMS can invest only in listed and rated securities. Their investment universe largely mirrors that of debt mutual funds, comprising government securities, corporate bonds, money market instruments, derivatives (restricted to hedging) and units of direct mutual funds and debt ETFs. Unlike mutual funds, debt PMS face no issuer-level or sector-level exposure limits in discretionary portfolios. In contrast, mutual funds in India cannot invest more than 10 per cent of their NAV in a single issuer or over 25 per cent in one sector, with an additional 10 per cent permitted for housing finance companies.
Most debt PMS strategies favour securities issued by non-banking financial companies (NBFCs) due to their frequent issuances, higher liquidity and the availability of detailed research and disclosures. This enhances transparency and comfort in credit selection. Similar to mutual funds, PMS managers negotiate directly with issuers to secure better yields, terms and covenants. While some participate in primary issuances, many prefer trading in the secondary market for smoother regulatory compliance. They often use the Request for Quote (RFQ) platforms of BSE and NSE, which allow institutional investors to source competitive bids from multiple dealers—enhancing price discovery, transparency and execution efficiency. Typically, debt PMS portfolios comprise 5-25 securities, reflecting their concentrated nature and active management approach.
Duration management
Duration positioning varies across PMS providers based on their investment philosophy. Some managers actively manage duration to capitalise on interest rate movements, while others prefer stable, hold-to-maturity structures.
For instance, PACE 360 Tresor Secure follows a dynamic approach, frequently rebalancing between government securities and corporate bonds, while Northern Arc Income Builder adopts a target-maturity style by buying and holding corporate bonds.
High-yield strategies
Debt PMSes often invest in lower-rated instruments to meet the higher return expectations of affluent investors. These securities offer elevated yields in exchange for higher credit risk, which managers seek to mitigate through rigorous credit analysis, internal scoring models and liquidity buffers.
For instance, Sundaram Conservative invests mainly in AAA to AA- rated papers, targeting yields around 9.5 per cent. Its Moderate variant allocates across AA+ to A- rated papers, targeting 10.5 per cent, while the Aggressive strategy leans towards BBB-rated issuers, aiming for 12.5 per cent. Similarly, PACE 360 Tresor Secure invests up to AA- rated instruments, while PhillipCapital Income Builder typically operates within the AA+ to A- rating band.
Performance
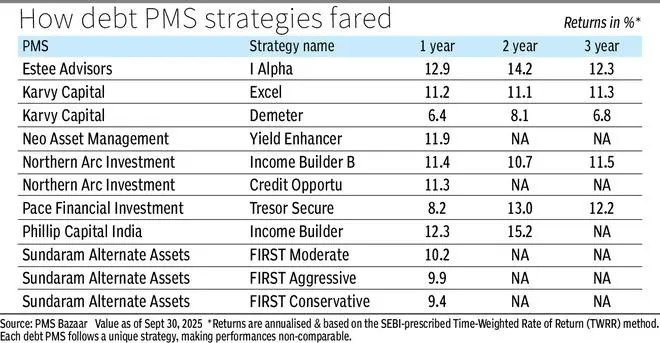
Each debt PMS strategy follows a different investment approach; hence, their performances are not directly comparable. As per PMS Bazaar data, one-year returns of these strategies range between 5 per cent and 12.9 per cent, while three-year returns range between 5.3 per cent and 12.3 per cent (see table). Returns are annualised and based on the SEBI-prescribed Time-Weighted Rate of Return (TWRR) method. PMS Bazaar categorises 17 strategies under debt. Its dataset primarily tracks actively-managed and widely-subscribed portfolios.
Expenses and fees
Debt PMS fee structures are performance-linked and negotiable, depending on the strategy and investor profile. As per the PMS Bazaar data, these debt strategies charge a fixed management fee ranging from 0.6 per cent to 2.5 per cent annually on AUM or a performance-based fee of 6-15 per cent on returns exceeding a pre-set hurdle rate, often benchmarked to the RBI repo rate or a comparable index.
Investor considerations
While debt PMSes offer bespoke portfolios and dynamic yield opportunities, they come with risks arising from credit quality, duration exposure, liquidity and changing tax or regulatory frameworks. Mutual funds, on the other hand, provide cost-efficient, diversified portfolios but are generally limited to the highest-rated (AAA/AA+) instruments with minimal exposure to ‘A’ rated papers.
Comparable mutual fund categories — credit risk, corporate bond and short-duration funds — carry significantly lower expenses, ranging from 0.5 per cent to 1.7 per cent for regular plans and 0.2 per cent to 1 per cent for direct plans. Over the past year, these categories have delivered annualised returns of 8.3 per cent, 8.2 per cent and 8 per cent, respectively.
For HNI investors, the key question is whether a debt PMS justifies its higher cost and concentration risk. If the PMS assumes greater credit or interest-rate exposure, it must consistently deliver superior risk-adjusted returns to warrant its premium pricing. Otherwise, mutual funds — with lower costs, better liquidity and broader diversification — remain a more practical choice for most investors.
Published on October 25, 2025