

dszc
This week’s Danger Zone idea is a mid-cap mutual fund that allocates to bad stocks, i.e. companies that are less profitable and more expensive than those in its benchmark and the overall market. Add in well above-average costs, and future outperformance of this fund looks unlikely. BlackRock Mid Cap Growth Equity Portfolio (MUTF:BMGAX) is this week’s Danger Zone pick.
Forward-Looking Research Protects Investors
Most legacy fund research is backward-looking. In other words, it is based on past price performance. Our fund research takes a forward-looking approach based on analysis and ratings on each individual holding.
Figure 1 shows how our forward-looking Fund Ratings compare to Morningstar (MORN) ratings. We rate BMGAX Unattractive (equivalent to Morningstar’s 1 Star) while Morningstar gives BMGAX a 3 Star rating. BMGCX, BMRRX, CMGIX, and CMGSX, other share classes of the mutual fund, also earn a 3 Star rating while we rate each Unattractive.
Figure 1: BlackRock Mid Cap Growth Equity Fund Ratings
New Constructs, LLC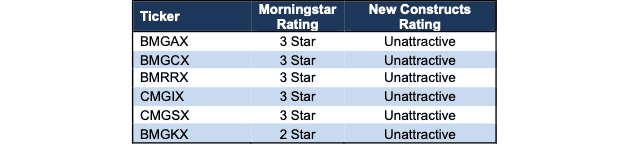
Sources: Company filings, mutual fund filings, and Morningstar
Methodology Short on Details
BlackRock Mid Cap Growth Equity Fund invests in “equity securities issued by U.S. mid-capitalization growth companies…that fund management team believes have above-average earnings growth potential.”
Unfortunately, investors are given few quantifiable details about how the fund managers go about selecting these stocks. The fund’s website describes the fund as follows:
- A high conviction, mid-cap growth strategy.
- Combines diversified sources of growth.
- Seeks to outperform in all markets.
The fund’s prospectus also notes that the investment strategy of the fund is to invest in mid-cap companies which have above-average earnings growth potential.
Without any more specifics on how this fund’s managers pick stocks, we judge BMGAX based on what we can measure: the quality of the stocks they hold.
Our analysis reveals BMGAX’s investment process leads to holdings with lower returns on invested capital (ROIC), lower cash flows, and more expensive valuations than its benchmark and the S&P 500. More details below.
Holdings Research Reveals a Low-Quality Mid Cap Portfolio
Our holdings analysis, which leverages our Robo-Analyst technology, reveals that BMGAX holds lower-quality stocks than its benchmark iShares Russell Mid-Cap Growth ETF (IWP). For reference, IWP earns an Attractive rating.
Per Figure 2, BMGAX allocates 70% of its portfolio to Unattractive-or-worse rated stocks compared to 44% for IWP. On the flip side, BMGAX allocates only 2% of its assets to Attractive-or-better rated stocks compared to 5% for IWP.
Figure 2: BlackRock Mid Cap Growth Equity Fund Allocates to Far Worse Stocks than IWP
New Constructs, LLC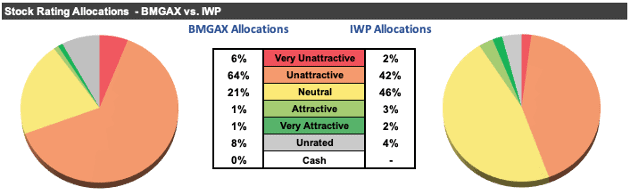
Sources: Company, ETF, and mutual fund filings
Per Figure 3, our holdings analysis also reveals BMGAX’s portfolio is lower quality than the S&P 500, as represented by State Street SPDR S&P 500 ETF (SPY), which earns an Attractive rating.
At just 36% of its portfolio, SPY allocates less to Unattractive-or-worse rated stocks compared to BMGAX. On the flip side, at 9% of its portfolio, SPY’s exposure to Attractive-or-better rated stocks is higher than BMGAX.
Figure 3: BlackRock Mid Cap Growth Equity Fund Allocates to Worse Stocks than SPY
New Constructs, LLC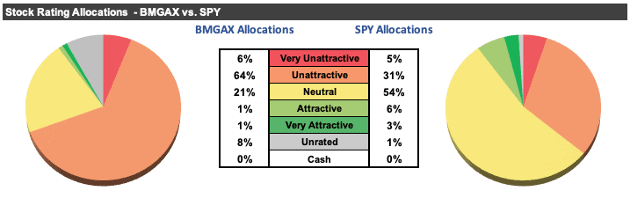
Sources: Company, ETF, and mutual fund filings
Given BMGAX allocates just 2% of assets to Attractive-or-better rated stocks, it appears poorly positioned to generate the outperformance required to justify higher active management fees.
Expensive Stocks Drive Unattractive Risk/Reward Rating
Figure 4 contains our detailed rating for BMGAX, which includes each of the criteria we use to rate all ETFs and mutual funds under coverage. These criteria are the same for our Stock Rating Methodology, as the performance of a mutual fund equals the performance of its holdings minus fees. Figure 4 also compares BMGAX’s rating with those of IWP and SPY.
Figure 4: BlackRock Mid-Cap Growth Equity Fund Rating Details
New Constructs, LLC
Sources: New Constructs, LLC, company, ETF, and mutual fund filings
As Figure 4 shows, BMGAX is inferior to IWP in all five criteria that make up our Portfolio Management rating. Specifically:
- BMGAX’s holdings have a Neutral Economic Earnings vs. EPS rating compared to Positive EE vs. EPS for IWP and SPY.
- BMGAX’s ROIC is 12%, which is lower than IWP’s (17%) and SPY’s (32%) ROIC.
- BMGAX’s 2-yr average free cash flow (FCF) yield of -1% is lower than IWP’s at 1% and SPY’s at 2%.
- The price-to-economic book value (PEBV) ratio for BMGAX is 7.2, which is greater than the 5.9 for IWP and the 4.3 for SPY.
- Our discounted cash flow (DCF) analysis reveals an average market-implied growth appreciation period (GAP) of 96 years for BMGAX’s holdings compared to 83 years for IWP’s and 73 years for SPY’s holdings.
Market expectations for stocks held by BMGAX imply profits will grow substantially more than the stock’s held by IWP and SPY (measured by PEBV ratio).
This rigorous holdings analysis reveals that BMGAX provides exposure to less profitable mid-cap companies, while taking much more valuation risk than the benchmark and S&P 500.
Fees Only Make Owning BMGAX Worse
At 3.28%, BMGAX’s total annual costs (TAC) are higher than 87% of Mid-Cap Growth mutual funds under coverage. For comparison, the simple average TAC of all the Mid-Cap Growth mutual funds under coverage is 1.64% and the asset-weighted average is 1.43%. IWP charges just 0.25% and SPY also has total annual costs of just 0.10%. Why pay higher fees for inferior stock selection?
Our TAC metric accounts for more than just the expense ratio. We consider the impact of front-end loads, back-end loads, redemption fees, and transaction costs – the latter of which adds 0.10% to BMGAX’s TAC.
Figure 5 shows our breakdown of BMGAX’s total annual costs.
Figure 5: BlackRock Mid-Cap Growth Equity Fund’s Total Annual Costs Breakdown
New Constructs, LLC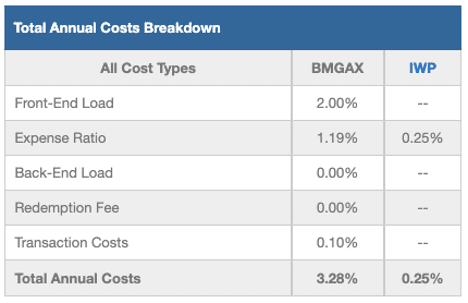
Sources: company, ETF, and mutual fund filings
To justify charging higher fees, BMGAX must outperform its benchmark by 302 basis points annually over three years.
However, BMGAX’s 3-year quarter-end trailing annual return has underperformed IWP by 665 basis points and SPY by 1683 basis points. BMGAX has also underperformed over the 1-year and 5-year periods.
Given that 70% of assets are allocated to stocks with Unattractive-or-worse ratings, and 98% are allocated to stocks with Neutral-or-worse ratings, BMGAX is likely to continue underperforming.
Get an Edge from Holdings-Based Fund Analysis Based on Superior Stock Research
Smart fund (or ETF) investing means analyzing each of the holdings of a fund. Failure to do so is a failure to perform proper due diligence. Simply buying an ETF or mutual fund based on past performance does not necessarily lead to outperformance. Only thorough holdings-based research can help determine if a fund’s methodology leads managers to pick high-quality or low-quality stocks.
Our diligence on holdings allows us to cut through the noise and identify potentially dangerous funds, like BlackRock Mid-Cap Growth Equity Fund, that traditional, backward-looking fund research overrates.
Easily Make Any Fund, Even BMGAX, Better
As we show in The Paradigm Shift to DIY ETFs, new technologies enable investors to create their own fund without any fees while also enabling better, more sophisticated weighting methodologies. For example, if we take the same stocks already in BMGAX and reallocate the capital to them so that the stocks with the best Core Earnings get the most capital, we get a much better fund.
Figure 6 compares our new customized version of BGMAX to the original. Not surprisingly, our new version allocates more capital to better stocks:
- 57% of assets to Unattractive-or-worse rated stocks (compared to 70% for BMGAX)
- 15% of assets to Attractive-or-better rated stocks (compared to 2% for BMGAX).
Compare the quality of stock allocation in as-is BMGAX vs. our customized version of BMGAX in Figure 6.
Figure 6: BlackRock Mid-Cap Growth Equity Fund Allocation Could Be Improved
New Constructs, LLC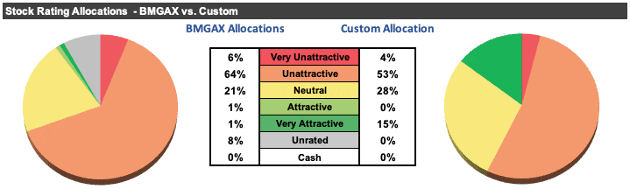
Sources: Company, and mutual fund filings
Better Options for Mid-Cap Growth Funds
Below we present Mid-Cap Growth ETFs or mutual funds that feature an Attractive rating, >$100 million in assets under management, and below average TAC:
- VictoryShares THB Mid Cap ETF (MDCP) – 0.61% TAC and Attractive rating
- iShares Morningstar Mid-Cap Growth ETF (IMCG) – 0.07% TAC and Attractive rating
- Vanguard Mid-Cap Growth Index Fund (VOT) – 0.08% TAC and Attractive rating
- Vanguard Mid-Cap Growth Index Fund (VMGMX) – 0.11% TAC and Attractive rating
This article was originally published on July 22, 2024.
Disclosure: David Trainer, Kyle Guske II, and Hakan Salt receive no compensation to write about any specific stock, sector, style, or theme.