

Indian equity markets have been in a corrective phase since September 2024, and the impact on SIP returns in equity mutual funds has been swift and visible. As highlighted in our earlier report (https://tinyurl.com/4jntrjmh), the 3-year SIP return in actively managed IT funds recently slipped into negative territory, the first such instance since the pandemic-led market disruption of early 2020.
Against this backdrop of volatility, how has the broader market SIP performed? A bl.portfolio analysis of 3-year rolling SIP returns on the Nifty 100 Total Return Index (TRI), a proxy for large-cap stocks, shows the XIRR falling from about 25 per cent in September 2024 to 9.7 per cent by February 2026. The decline is sharper in the broader market. The 3-year SIP return for the Nifty Midcap 150 TRI has dropped from around 39 per cent to 14 per cent over the same period, while the Nifty Smallcap 250 has fallen from about 40 per cent to 7.2 per cent.
For investors tracking their SIP dashboards, the decline is difficult to ignore. But does it point to a deeper problem, or is it simply part of the normal ups and downs of the market? To answer this, we examine rolling SIP returns across 3-, 5-, 7-, 10- and 15-year periods to understand what long-dated data actually show.
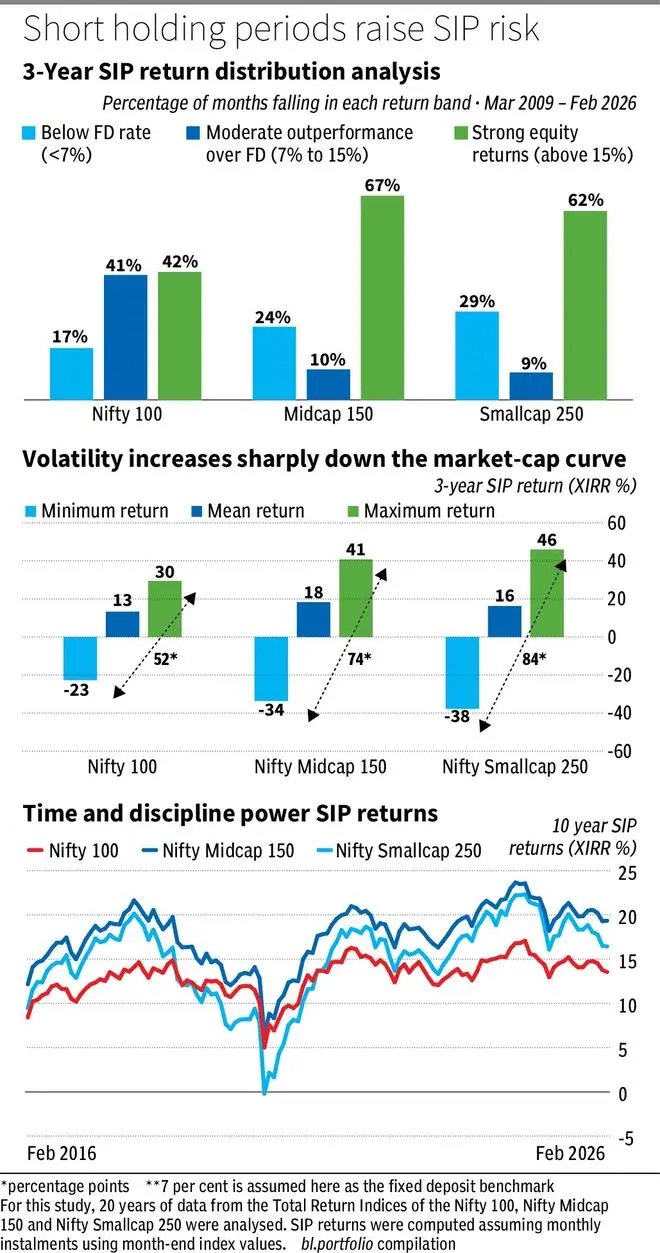
For this study, 20 years of data from the Total Return Indices of the Nifty 100, Nifty Midcap 150 and Nifty Smallcap 250 were analysed. SIP returns were computed assuming monthly instalments using month-end index values. SIP returns are measured using XIRR, or extended internal rate of return, which calculates the annualised return for investments made at different dates and amounts, as is the case with periodic SIP instalments.
Possibility of negative returns
The data show that negative SIP outcomes do occur, but their frequency depends heavily on the segment and the holding period. They are a normal part of equity investing, especially over shorter holding periods. Three-year SIP returns have turned negative during market stress periods such as the global financial crisis of 2008–09 and the pandemic shock of 2020.
Even in the relatively stable Nifty 100, a 3-year SIP has delivered negative returns in 9 out of 204 months, or about 4 per cent of the time. In the Nifty Midcap 150, negative outcomes occurred in 20 months, or roughly 10 per cent of the time. The frequency is much higher in the Nifty Smallcap 250, where a 3-year SIP generated negative returns in 45 months, accounting for about 22 per cent of the observations.
The depth of losses also varies sharply across segments. The worst 3-year SIP return on the Nifty Smallcap 250 was -37.8 per cent, compared with -33.6 per cent on the Nifty Midcap 150 and -22.7 per cent on the Nifty 100.
Another striking aspect is the duration of such phases. The Nifty Smallcap 250 remained in negative 3-year SIP return territory for 26 consecutive months during the period between September 2018 and October 2020. In contrast, the longest such stretch was just four months for the Nifty 100 and five months for the Nifty Midcap 150.
The encouraging takeaway is that the risk of negative outcomes falls sharply as the investment horizon increases. At a 7-year tenure, only the Nifty Smallcap 250 has briefly slipped into negative territory, with a return of about -6 per cent. At 10 years, even smallcap has touched near-zero only once, at -0.2 per cent. Large- and mid-cap indices have not produced negative SIP returns beyond five-year periods.
A 3-year large-cap SIP gives sub-FD returns in one out of six months
The 3-year rolling SIP data for the Nifty 100 shows that the return fell below 7 per cent, assumed here as the fixed deposit benchmark, in 34 out of 204 months. That is about 17 per cent of the time. The proportion rises to around 24 per cent for mid-caps and nearly 29 per cent for small-caps.
The incidence of such underperformance declines as the holding period increases. For a 5-year SIP, the share of periods with returns below 7 per cent falls to about 10 per cent for large-caps and around 14 per cent for mid-caps. However, for small-caps it remains relatively high at about 30 per cent, reflecting the deeper drawdowns typical of this segment.
With a 7-year SIP tenure, the frequency drops further to about 3 per cent for large-caps, 6 per cent for mid-caps and 18 per cent for small-caps.
This pattern highlights the importance of staying invested for longer periods. Interestingly, the AMFI Annual Report 2025 shows that despite improving investor behaviour, a large share of SIP assets are still held for shorter periods. As of March 2025, about 81 per cent of direct SIP assets and 67 per cent of regular SIP assets were held for less than five years.
Volatility increases sharply down the market-cap curve
Return volatility rises significantly as one moves down the market-cap ladder. The worst 3-year SIP return on the Nifty 100 was -22.7 per cent, while the best was 29.5 per cent, a spread of about 52 percentage points. For the Nifty Midcap 150, the range widens from -33.6 per cent to 40.8 per cent, a spread of about 74 percentage points. On the Nifty Smallcap 250, the range stretches from -37.8 per cent to 46 per cent, nearly 84 percentage points.
The same pattern holds for 5-year SIP returns. The Nifty 100 has delivered between -3.1 per cent and 23.1 per cent across 5-year periods. The Nifty Midcap 150 has ranged between -6.9 per cent and 36.4 per cent, while the Nifty Smallcap 250 has swung between -17 per cent and 38.5 per cent.
Takeaway
The key takeaway is straightforward. Those investing in mid- and small-cap funds through SIPs need patience. A horizon of at least seven years, and ideally 10 years, is necessary to smooth out volatility. The shorter the investment horizon, the higher the chances of seeing negative or below fixed-deposit returns. Large-cap funds are relatively more stable, but even there a three-year horizon may be too short. Staying invested and allowing time to work remains the most reliable way to benefit from SIP investing.
With inputs from Kumar Shankar Roy
Published on March 7, 2026