
")
designer491
Strategy
Invesco Fundamental High Yield® Corporate Bond ETF (NYSEARCA:PHB) started investing operations on 11/15/2007 and tracks the RAFI® Bonds U.S. High Yield 1-10 Index. It has 241 holdings, a yield to maturity of 6.25%, a 30-day SEC yield of 5.85% and an expense ratio of 0.50%. Distributions are paid monthly.
As described by Invesco in the prospectus, the underlying index starts from a universe of exchanged-traded debt whose issuers are public companies domiciled in the U.S., then…
…selects and weights securities based on the Fundamental Index® approach developed by RA that uses four fundamental factors of company size: book value of assets, gross sales, gross dividends and cash flow. Only non-convertible, non-exchangeable, non-zero, fixed coupon high-yield corporate bonds qualify for inclusion in the Underlying Index.
The portfolio turnover rate in the most recent fiscal year was 31%.
Portfolio
The heaviest sector in the portfolio is consumer discretionary (24.3% of asset value), followed by industrials (14%). Other sectors are below 9%.
Sector breakdown in % of asset value (Chart: author; data: Invesco)
About 11% of asset value is at the lower end of investment grade (BBB rating by S&P), and 76% is at the upper end of “junk bond” rating (BB). Therefore, the PHB portfolio has a relatively high-quality profile in the high-yield corporate bond category.
Quality breakdown in % (Chart: author; data: Invesco)
About 61% of assets has maturity between 5 and 10 years. The portfolio’s weighted average years to maturity is 5.29 years.
Maturity breakdown in % (Chart: author; data: Invesco)
The next table lists the top 10 issuers, which represent 13.6% of asset value. The portfolio is well-diversified and risks related to individual companies are low.
|
Name |
Common stock |
Weight% |
|
Ford Motor |
2.07 |
|
|
Walgreens Boots Alliance, Inc. |
1.71 |
|
|
Centene Corporation |
1.63 |
|
|
Occidental Petroleum Corporation |
1.35 |
|
|
Synchrony Financial |
1.22 |
|
|
Level 3 Financing Inc |
1.15 |
|
|
United Airlines Holdings, Inc. |
1.15 |
|
|
Paramount Global |
1.13 |
|
|
Ally Financial Inc. |
1.11 |
|
|
Delta Air Lines, Inc. |
1.07 |
Performance
This section will use as a benchmark the Bloomberg High Yield Very Liquid Index, represented by SPDR Bloomberg High Yield Bond ETF (JNK). PHB has underperformed JNK by 0.9% in annualized return since inception and shows a deeper maximum drawdown. Its risk-adjusted performance (Sharpe ratio) is significantly inferior to the benchmark.
|
Total Return |
Annual.Return |
Drawdown |
Sharpe ratio |
Volatility |
|
|
PHB |
78.44% |
3.52% |
-44.79% |
0.26 |
10.91% |
|
JNK |
113.20% |
4.63% |
-38.47% |
0.35 |
11.79% |
Nonetheless, PHB has marginally outperformed JNK over the last 3 years.
PHB vs JNK, 3-year return (Seeking Alpha)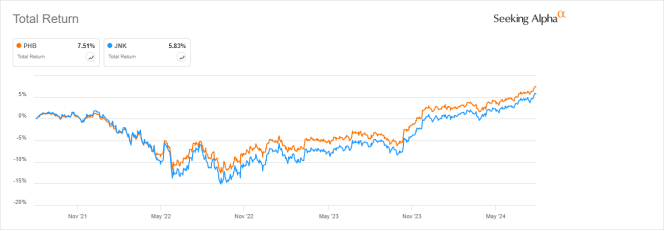
PHB share price has lost 6% in 10 years (excluding distributions). While it has been paying a high yield, the fund has suffered a loss in capital. For shareholders, this decay was amplified by cumulative inflation: about 32% in the same time, based on CPI.
PHB price return (Seeking Alpha)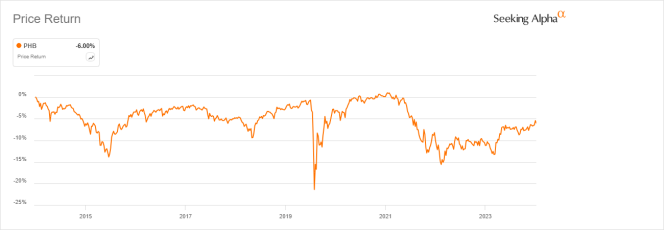
The annual sum of distributions has also slightly decreased in 10 years, from $0.89 per share in 2013 to $0.85 per share in 2023 (despite a bounce in 2023). For shareholders, it also represents a significant loss of income stream measured in inflation-adjusted value.
PHB distribution history (Seeking Alpha)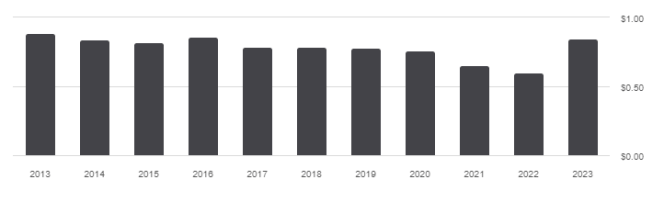
PHB vs. competitors
The next table compares characteristics of PHB and five high-yield corporate bond ETFs implementing strategies based on fundamentals, maturity or other characteristics:
- iShares 0-5 Year High Yield Corporate Bond ETF (SHYG)
- VanEck Fallen Angel High Yield Bond ETF (ANGL)
- iShares Fallen Angels USD Bond ETF (FALN)
- First Trust Tactical High Yield ETF (HYLS)
- FlexShares High Yield Value-Scored Bond Index Fund (HYGV).
|
PHB |
SHYG |
ANGL |
FALN |
HYLS |
HYGV |
|
|
Inception |
11/15/2007 |
10/15/2013 |
4/10/2012 |
6/14/2016 |
2/25/2013 |
7/17/2018 |
|
Expense Ratio |
0.50% |
0.30% |
0.25% |
0.25% |
1.02% |
0.37% |
|
AUM |
$565.80M |
$6.16B |
$3.02B |
$1.71B |
$1.48B |
$1.44B |
|
Avg Daily Volume |
$3.41M |
$49.80M |
$25.56M |
$18.42M |
$6.63M |
$5.38M |
|
Dividend Yield TTM |
5.34% |
6.64% |
5.92% |
5.85% |
6.31% |
8.58% |
|
4-Year Average Yield |
3.98% |
5.62% |
4.81% |
4.88% |
6.11% |
7.36% |
PHB is the smallest of these funds (in assets under management) and the least liquid (in dollar volume). It has the lowest yield and the second-highest expense ratio. The next chart plots total returns, starting on 7/23/2018 to match all inception dates. PHB is in the middle of the pack and behind the “fallen angels” funds, which invest in debt of companies having lost their investment grade rating.
PHB vs. Competitors since 7/23/2018 (Seeking Alpha)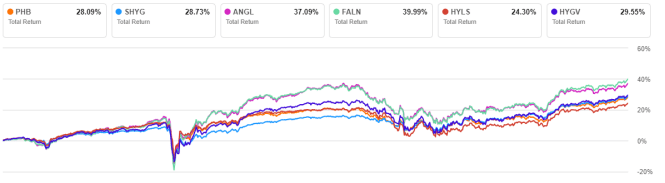
Over the last 10 years, PHB lags ANGL by 32.5% in total return:
PHB vs. ANGL, 10-year return (Seeking Alpha)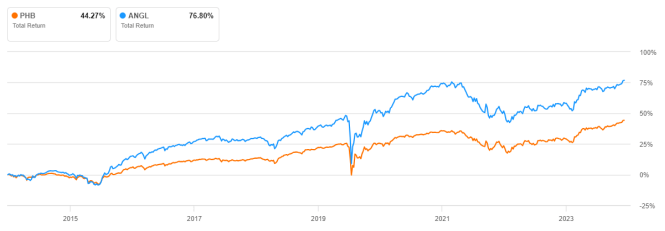
Takeaway
Invesco Fundamental High Yield® Corporate Bond ETF selects and weights high-yield corporate bonds (“junk bonds”) based on fundamental metrics. It is well diversified across issuers, with a focus on the consumer discretionary sector.
Despite a safer risk profile, PHB has underperformed a junk bond benchmark since inception. It shows moderate decays in price and distributions over the last 10 years, resulting in significant losses in inflation-adjusted value for shareholders. PHB fundamental strategy doesn’t seem to bring added value compared to a benchmark and competitors. In particular, it has lagged fallen angels ETFs by a significant margin.