

Portfolio management schemes (PMS) are intended to outperform the market and the investment vehicle for the public at large—mutual funds. But in the past five years, PMS have, as a set, trailed mutual funds in beating market benchmarks. PMS are offered by registered investment firms and mutual funds, with a minimum investment limit of ₹50 lakh. Since they allow for greater customisation, flexibility and dynamism, they offer the possibility of higher returns. However, an analysis of their regulatory filings shows this hasn’t been the case in five years to December 2024.
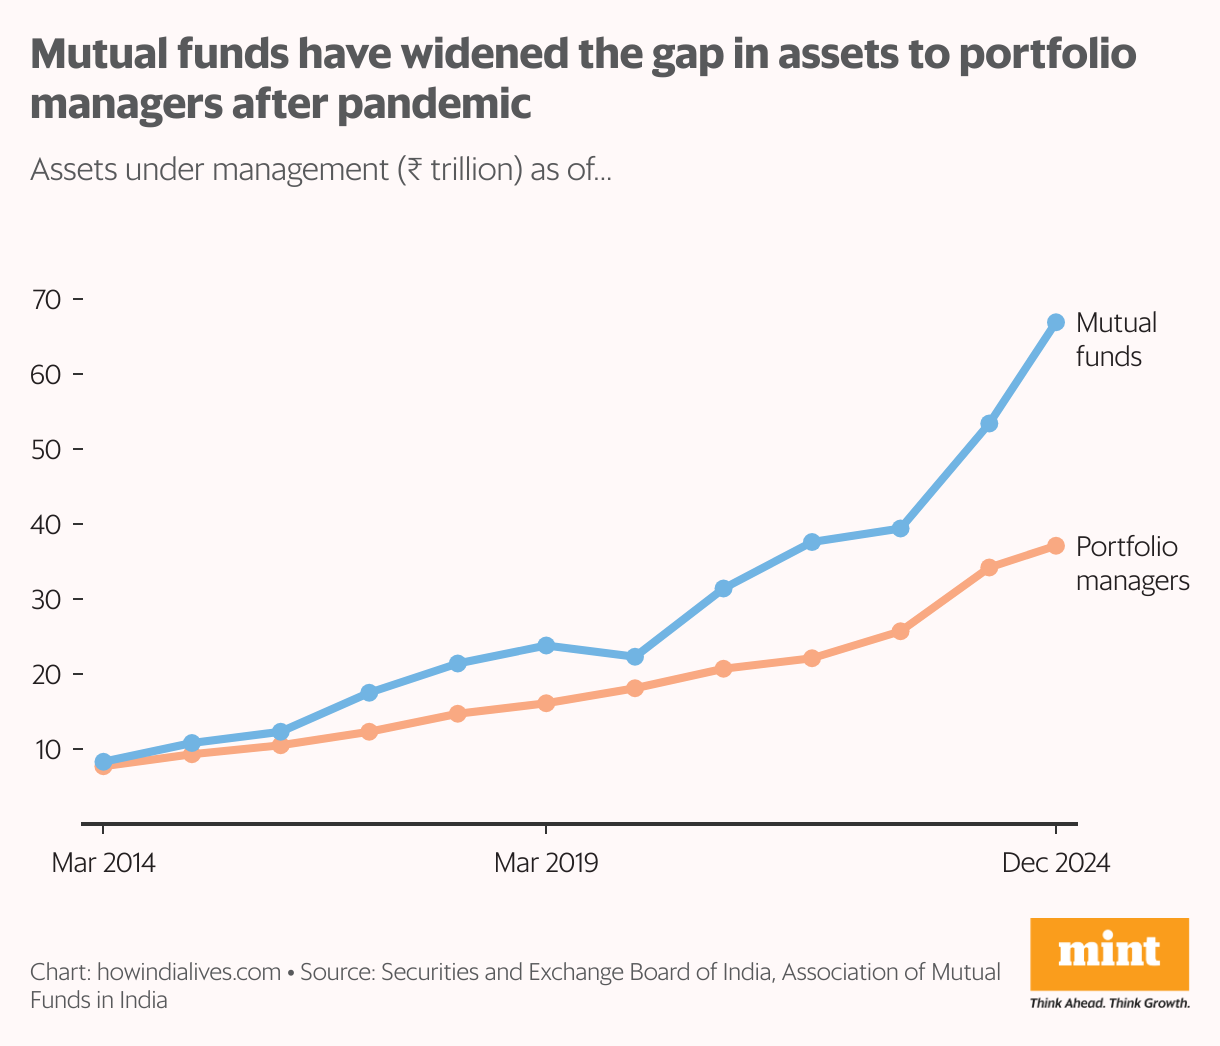
There was a time when PMS matched mutual funds on assets under management (AUMs). In March 2014, mutual fund AUMs exceeded those of PMS by only 7%. Both sets have seen their AUMs grow briskly since. But the faster growth of mutual funds (average of 21% per year versus 16% for PMS) has seen that gap progressively widen. As of December 2024, mutual fund AUMs were 81% higher than PMS.
Also read | The week in charts: Market rout, salary hikes, Delhi earthquake
Data from the market regulator shows there were 364 portfolio managers in December 2024, managing ₹37.1 trillion for about 193,000 clients. Performance data, along with benchmarks, is available for 1,248 investment plans covering about ₹4.4 trillion in assets. In the equity space, the outperformance of PMS compares well with that of mutual funds. About 62% of plans beat their corresponding benchmark, against 64% for direct plans of mutual funds. But in the debt and hybrid space, PMS have fewer instances of beating market benchmarks than mutual funds.

PF prominence
Funds belonging to the Employees’ Provident Fund Organisation (EPFO) and other provident fund (PF) accounts make up nearly three-fourths of the ₹37.1 trillion of PMS assets. This has been the case throughout the past decade. Another 10% is corporate savings. As of December 2024, high-net-worth individuals accounted for about 9.3% of the total assets of PMS, while representing about 94% of the 193,000 PMS clients.

The top three portfolio managers by assets managed are SBI Funds Management ( ₹1.47 trillion), Darashaw and Company ( ₹1.43 trillion) and UTI AMC ( ₹1.35 trillion). Each is a designated fund manager to manage EPFO-PF money, with the share of this money accounting for 74-96% of their total AUMs. In general, there is a concentration in the PMS space, with the top 20% portfolio managers by assets (73 firms) managing about 97% of assets and 84% of clients.
Debt orientation
In terms of asset classes, as much as 76% of the total PMS corpus is channelled into debt securities. Equities are the next biggest asset class in the PMS landscape, with an 11.3% share. For both equity and plain debt investments, about 99% is in listed securities, underscoring the importance of liquidity.
Also read: Market correction or full-blown bear hug? Investors brace for uncertainty
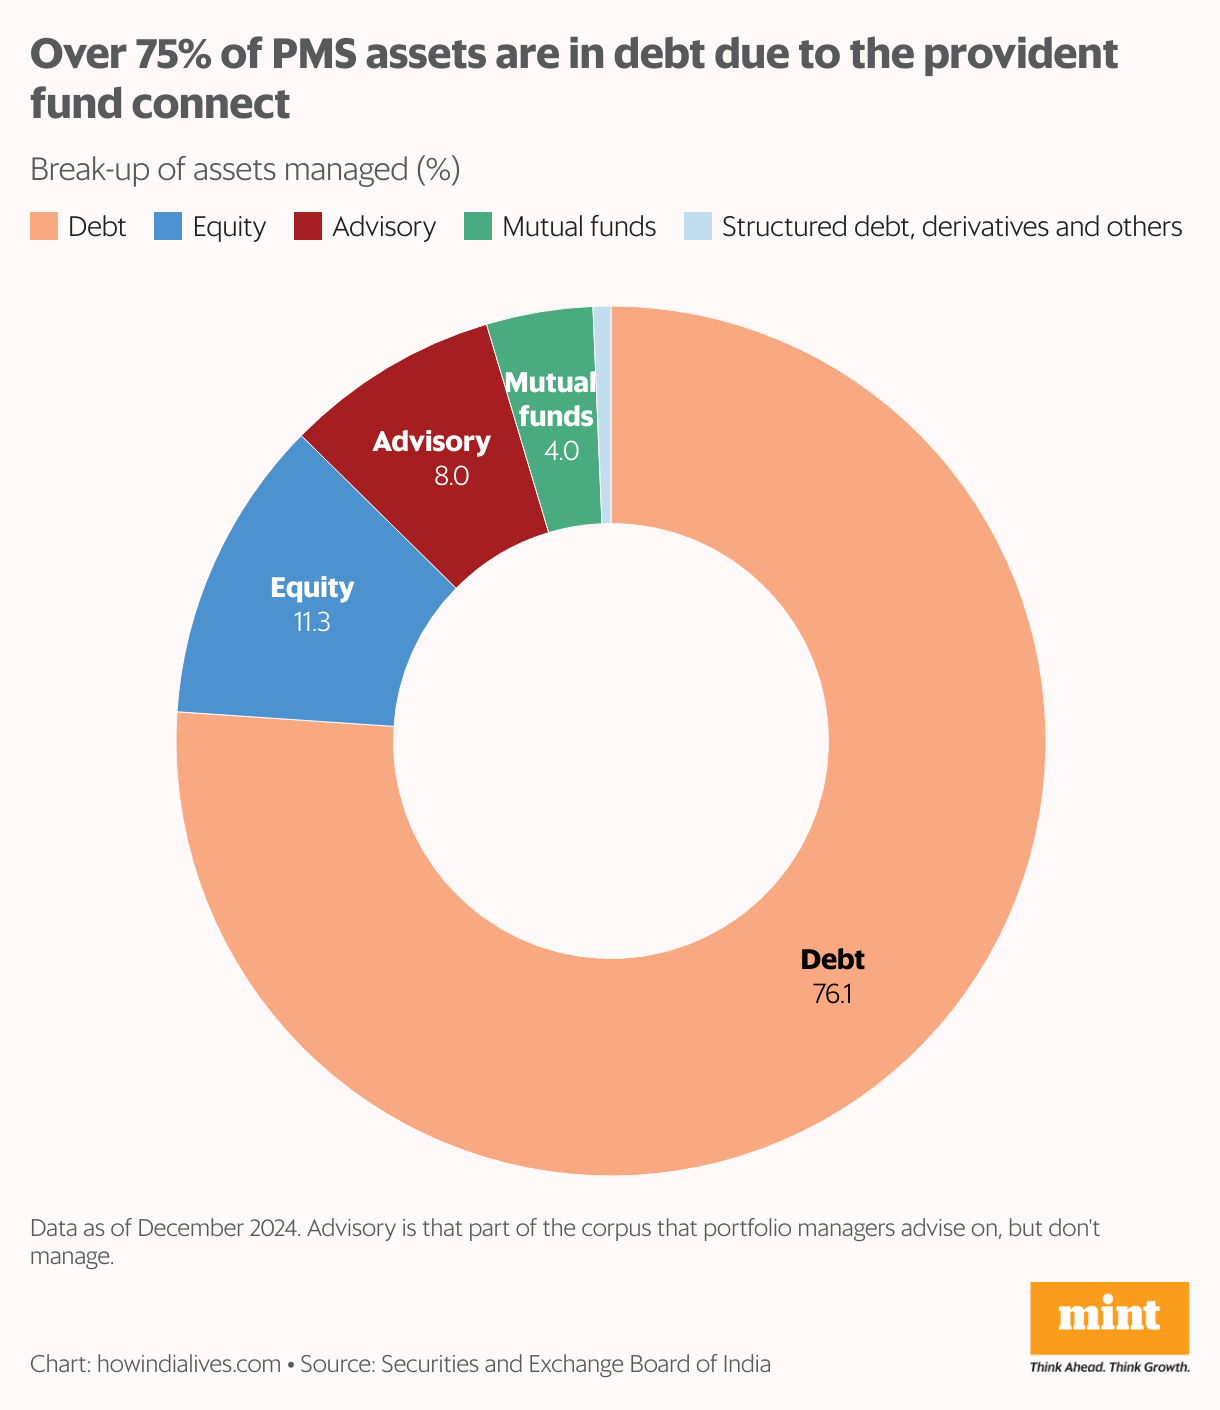
This debt orientation is because of EPFO guidelines on where its corpus can be invested, which lean heavily towards debt. According to government data, as of March 2024, equities accounted for only 9.5% of the EPFO corpus. Within these broad asset classes, fund managers have freedom, and about 84% of the ₹37.1 trillion managed by portfolio managers are discretionary investments. This is where they try to beat market benchmarks, but they haven’t succeeded on the debt side. In the past five years, only 31% of investment plans on the debt side beat their benchmarks.
Strength in numbers
Underwhelming performance raises the question of whether it is worth paying the extra expenses that PMS charge compared to mutual funds. PMS have grown from about 57,000 clients in March 2014 to about 193,000 in December 2024. The investment space is also evolving. For example, in September 2024, the regulator allowed mutual funds to offer riskier investment plans, positioned just below PMS, with a minimum investment of ₹10 lakh.

Also read | A sugar-coated catastrophe: Groundwater crisis in Uttar Pradesh
As of December 2024, mutual funds occupied two of the top three spots in the top 10 list of portfolio managers by number of clients: ICICI Prudential AMC Ltd and Motilal Oswal AMC. In this top 10 list, most portfolio managers averaged assets per client in the range of ₹1-2 crore. Barring exceptions, most large portfolio managers handling corporate portfolios also tended to be strong on the individual side.
www.howindialives.com is a database and search engine for public data.