

The rap on actively managed funds is pretty well-established after their most recent 10-year run. They suffered consistent outflows (save for 2021), they struggled to outperform their passive counterparts, and for the first time ever, in 2024, total assets in US passive mutual funds and ETFs surpassed their own.
It sounds bleak, but that by no means spells the end for active management. Active managers continue to find ways to offset outflows in active funds, primarily through the appreciation of assets and fee bases in a hot market. A different market environment, however, could cause consternation.
Last year, active small-cap managers fared better than their mid- and large-cap counterparts. They experienced a 43% success rate against their average passive peer. Active mid-cap and large-cap managers both experienced a 37% success rate, falling prey to a strong year from index funds.
Let’s use the Morningstar US Active/Passive Barometer Report for 2024 to break down these three categories further and get a better idea of what happened.
What Is the Morningstar Active/Passive Barometer?
The Morningstar Active/Passive Barometer is a semiannual report that measures the performance of active funds against passive peers in their respective Morningstar Categories. The report spans nearly 9,279 unique funds that accounted for approximately $23 trillion in assets, or about 68% of the US fund market, at the end of 2024.
The Active/Passive Barometer measures active managers’ success in several unique ways.
- It evaluates active funds against a composite of passive funds. In this way, the “benchmark” reflects the actual, net-of-fees performance of investable passive funds.
- It considers how the average dollar invested in active funds has fared versus the average dollar invested in passive funds.
- It examines trends in active-fund success by fee level.
- It shows the distribution of surviving active funds’ excess returns versus their average passive peer to help investors understand not just the odds of picking a successful manager but also the prospective payout or penalty.
The barometer is a useful tool that helps investors calibrate the odds of succeeding with active funds in different categories.
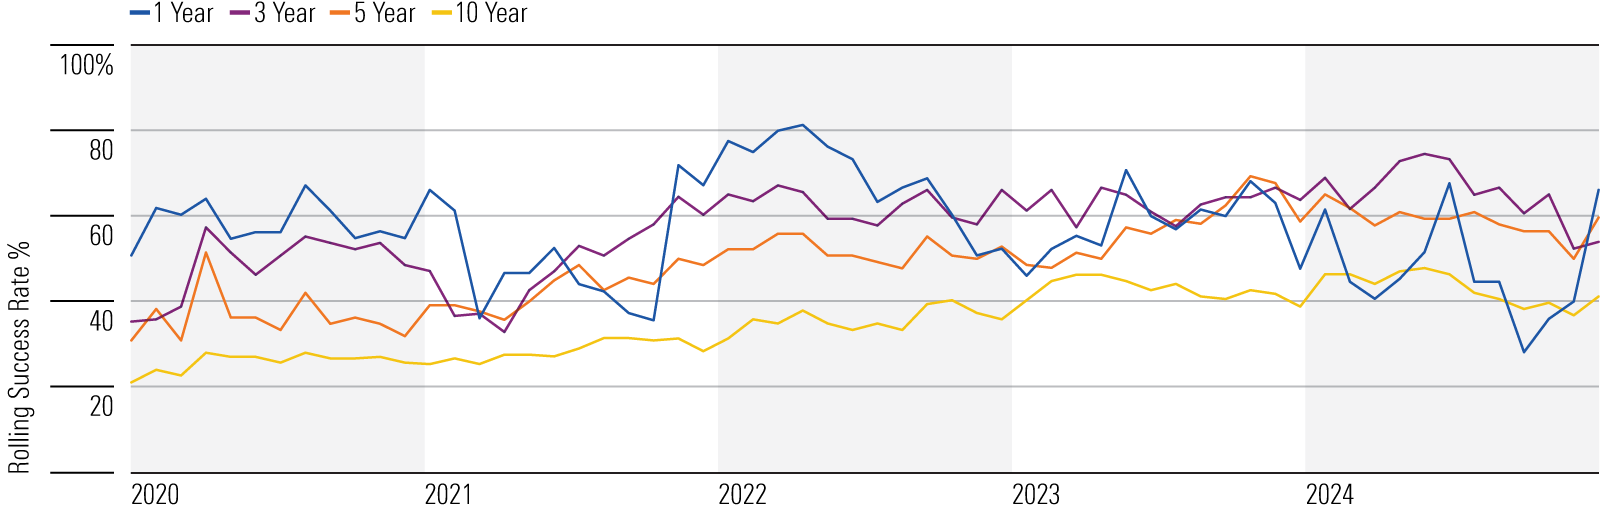
The Difficulty With the US Large-Cap Equity Market
The US large-cap equity market has been a challenging place for active funds to succeed in the long run. Just 7% of them survived and beat their average passive rival over the decade through December 2024. That fell well short of the 22% and 26% success rates for active mid- and small-cap managers, respectively.
Active US large-cap managers fared better in 2024, though. Their 37% success rate marked a 4-percentage-point increase from 2023. Active large-growth managers posted a 40% one-year success rate, up from 20% in 2023, while large-value managers’ success rate dropped 13 percentage points from the prior year.
Active Funds’ Success Rate by Category (%)
Source: Morningstar. Data and calculations as of Dec. 31, 2024.
Investors mostly favor cheaper, better-performing active large-cap funds. Expensive active large-cap funds must overcome long odds to succeed: Less than 5% of them beat a composite of their passive peers over the decade through 2024, compared with 12% of cheaper active large-cap strategies.
Over the decade, passive large-growth funds beat their active peers by 2.3 percentage points annualized on an asset-weighted basis—the widest performance margin across all Morningstar Categories. Passive large-blend funds posted a 1.7-percentage-point annual advantage over the same span.
Year-Over-Year Change in Active Funds’ One-Year Success Rate by Category (%)
Source: Morningstar. Data and calculations as of Dec. 31, 2024.
The median 10-year excess return for surviving active funds was negative across all three US large-cap categories, and the distributions of excess returns for the blend, growth, and value categories had a negative skew. That means not only was the likelihood of picking a successful manager low, but also the penalty for poor manager selection tended to be far greater than the reward for choosing a winner.
All this to say that it can be tricky for financial advisors and portfolio managers to succeed in the US large-cap fund universe. But before you go swapping out funds, advisors should compare portfolios before and after to avoid any unintended changes to other factors, like sector or regional exposure. Portfolio analysis tools can help clients visualize trade-offs and understand the potential impact of your proposal.
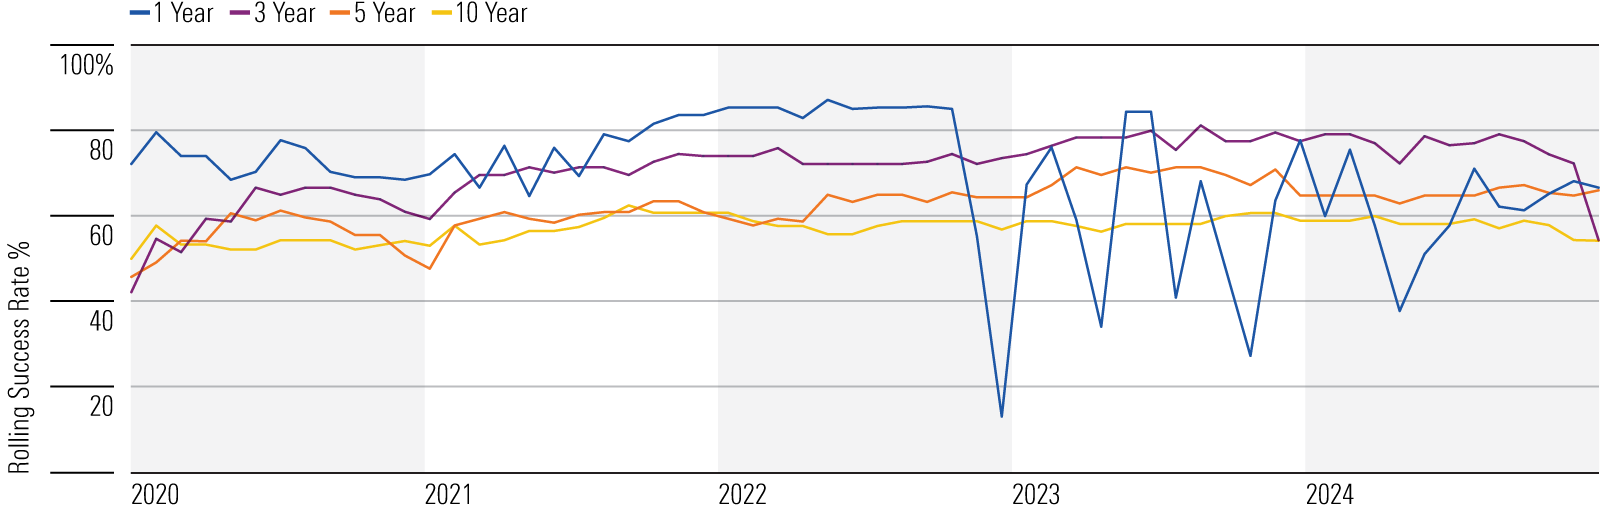
Mixed Results for Active Mid-Cap Fund Categories
Thirty-seven percent of active mid-cap funds survived and outpaced the average passive peer over the 12 months through 2024, a decline of 8 percentage points from one year earlier. While the headline may be “active mid-cap success rate decreased,” the nuance is the different mid-cap categories saw mixed results.
Mid-cap funds hunt at the “crossroads” of large- and small-cap companies, which leads to oscillating success rates. Active mid-cap value funds’ success rates declined by 35 percentage points, while active mid-cap growth managers improved by 11 percentage points. These categories’ success rates have been more volatile than large- or small-cap categories in recent years.
Active Funds’ Success Rate by Category (%)
Source: Morningstar. Data and calculations as of Dec. 31, 2024.
Year-Over-Year Change in Active Funds’ One-Year Success Rate by Category (%)
Source: Morningstar. Data and calculations as of Dec. 31, 2024.
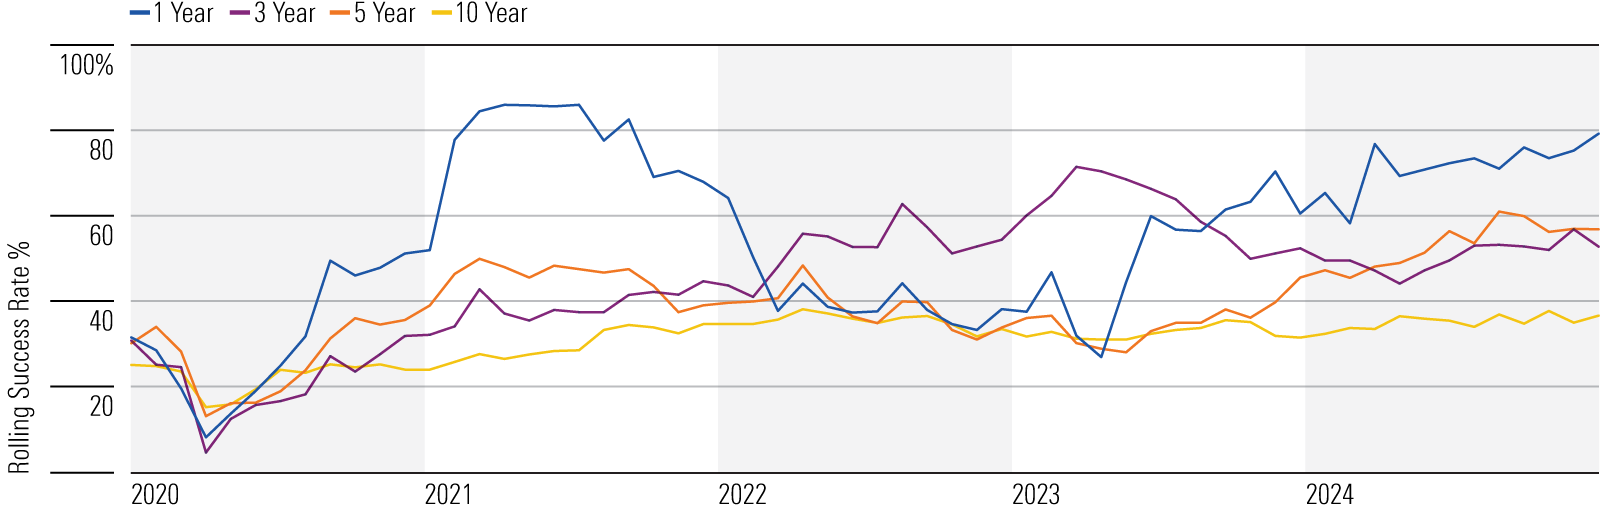
More Success for Active Small-Cap Fund Categories
Long-term active success rates have been higher in the small-cap arena than those among large-cap funds. That may be because the small-cap market is relatively less efficiently priced. Over 43% of active small-cap strategies survived and outpaced their average passive rival in 2024, a slight improvement over 2023.
Relative success versus large caps hasn’t amounted to much for active small-cap managers, though. Just 26% survived and outperformed their average passive peer over the decade through 2024. Still, active small-growth managers had the best odds of success (35%) among US equity categories over the past 10 years.
Active Funds’ Success Rate by Category (%)
Source: Morningstar. Data and calculations as of Dec. 31, 2024.
Year-Over-Year Change in Active Funds’ One-Year Success Rate by Category (%)
Source: Morningstar. Data and calculations as of Dec. 31, 2024.
Where Active Management Still Shines: Real Estate and Fixed Income
Real Estate
Over the decade through 2024, 47% of actively managed US real estate funds survived and beat their average passive peer, marking the highest success rate among category groups tracked in the Active/Passive Barometer. When looking for long-term exposure to US real estate, actively managed funds could be as good a place to start as any.
Screening and comparison tools can help advisors surface the right investments for a client’s portfolio across traditional and alternative investments. By helping investors decipher data points beyond returns—like expenses, manager experience, and portfolio risk—advisors can build trust in the relationship.
Success rates in the global real estate category fluctuate dramatically over shorter time horizons. This owes to the diversity of funds within the category. Some invest exclusively outside the United States, while others are more truly global. Differences in performance between US and ex-US real estate securities cause active managers’ success rates to ebb and flow. In 2024, active global real estate funds succeeded 67% of the time, a decline of 11 percentage points from the year prior.
Fixed Income
Fixed income has been a fertile hunting ground for active managers. Over the past decade, 45% survived and beat their average passive peer. The reward for picking a successful manager also outweighed the penalty of failure for active bond managers, based on positively skewed 10-year excess returns.
In 2024, active bond managers’ success rates increased for all three categories: intermediate core bonds, corporate bonds, and high-yield bonds. Active intermediate core bond managers led the pack with a sterling 79% success rate, up 18 percentage points from 2023. Actively managed funds in the intermediate core bond category tend to take more credit risk than indexed peers. That extra dose of risk aided active managers when credit spreads narrowed in 2023 and 2024.
There’s a Lot More to Unpack With Active vs. Passive Fund Performance in 2024
Year-over-year foreign stock, emerging-markets, and fixed-income results all warrant a look for financial advisors and portfolio managers exploring the difference in success between active and passive funds. You can read about them in the Morningstar US Active/Passive Barometer Report for 2024.
If you’re a financial advisor looking to explore the data on your own terms, consider getting a tour of Morningstar’s Direct Advisory Suite. It combines a variety of tools spanning proposal creation, investment research, and investment planning.