

Anthony Bradshaw
In a new environment of surging public debt, deglobalization, escalating geopolitical conflicts, and supply chain disruptions, gold might displace bonds in strategic allocations.
The US debt has reached nearly $35 trillion due to relentless deficit spending, which accelerated after the 2020 pandemic.
US Public Debt (FRED)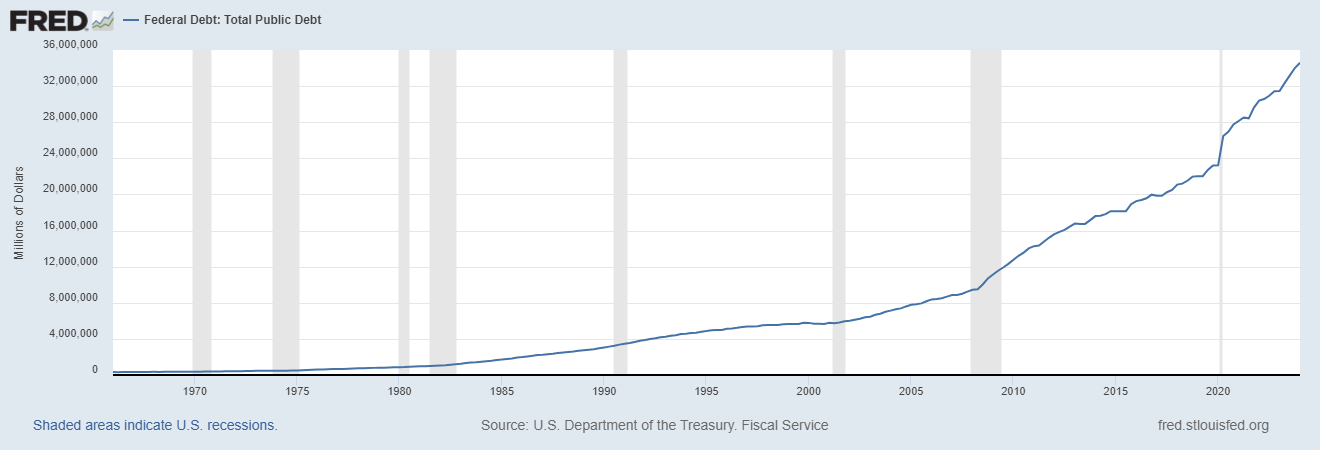
In 2022, supply chain disruptions and an increase in the money supply both significantly fueled inflation. A group of large-cap stocks, known as the Magnificent Seven, mainly boosted stocks, which continued to advance due to higher nominal growth, while bonds took a severe hit.
Investors must restructure their portfolios and find an alternative to bonds if a regime change occurs and the fixed income market’s problems persist for the foreseeable future.
In another SA article on April 27, 2022, we discussed using managed futures as an alternative to bonds in the 60/40 portfolio. In this article, we consider gold as an alternative to bonds.
Investing in gold is a controversial subject and has triggered a constant analyst clash on financial social media. Some analysts claim that gold has not provided any advantage to strategic allocations, while others insist it should have a sizeable allocation.
After reviewing some social media threads, disagreements appear to be partly due to back-testing investing horizons and a recent push to consider digital assets like Bitcoin as gold alternatives.
The major advantage of gold is this, as the renowned author, trader, and finance professor Nassim N. Taleb argued in a recent discussion on CNBC’s Squawk Box: “If you put in the ground a gold chain for ten thousand years, it will still be gold.” This may or may not be true for digital assets. In other words, gold has passed the test of time, and financial assets are very new in comparison. However, it is important to quantify what role gold can play in strategic allocations and whether it can serve as an alternative to bonds.
In many financial blogs and on social media, there is a common misconception that gold has consistently underperformed stocks. This is only true for long investment horizons. For example, since 1990, gold has underperformed stocks (SPX) by a factor of nearly 6 in terms of total return, but since 2000, gold has outperformed stocks by a factor of about 1.5.
Relative performance of the S&P 500 index total return and spot Gold for different lookback periods (Price Action Lab Blog – Norgate Data)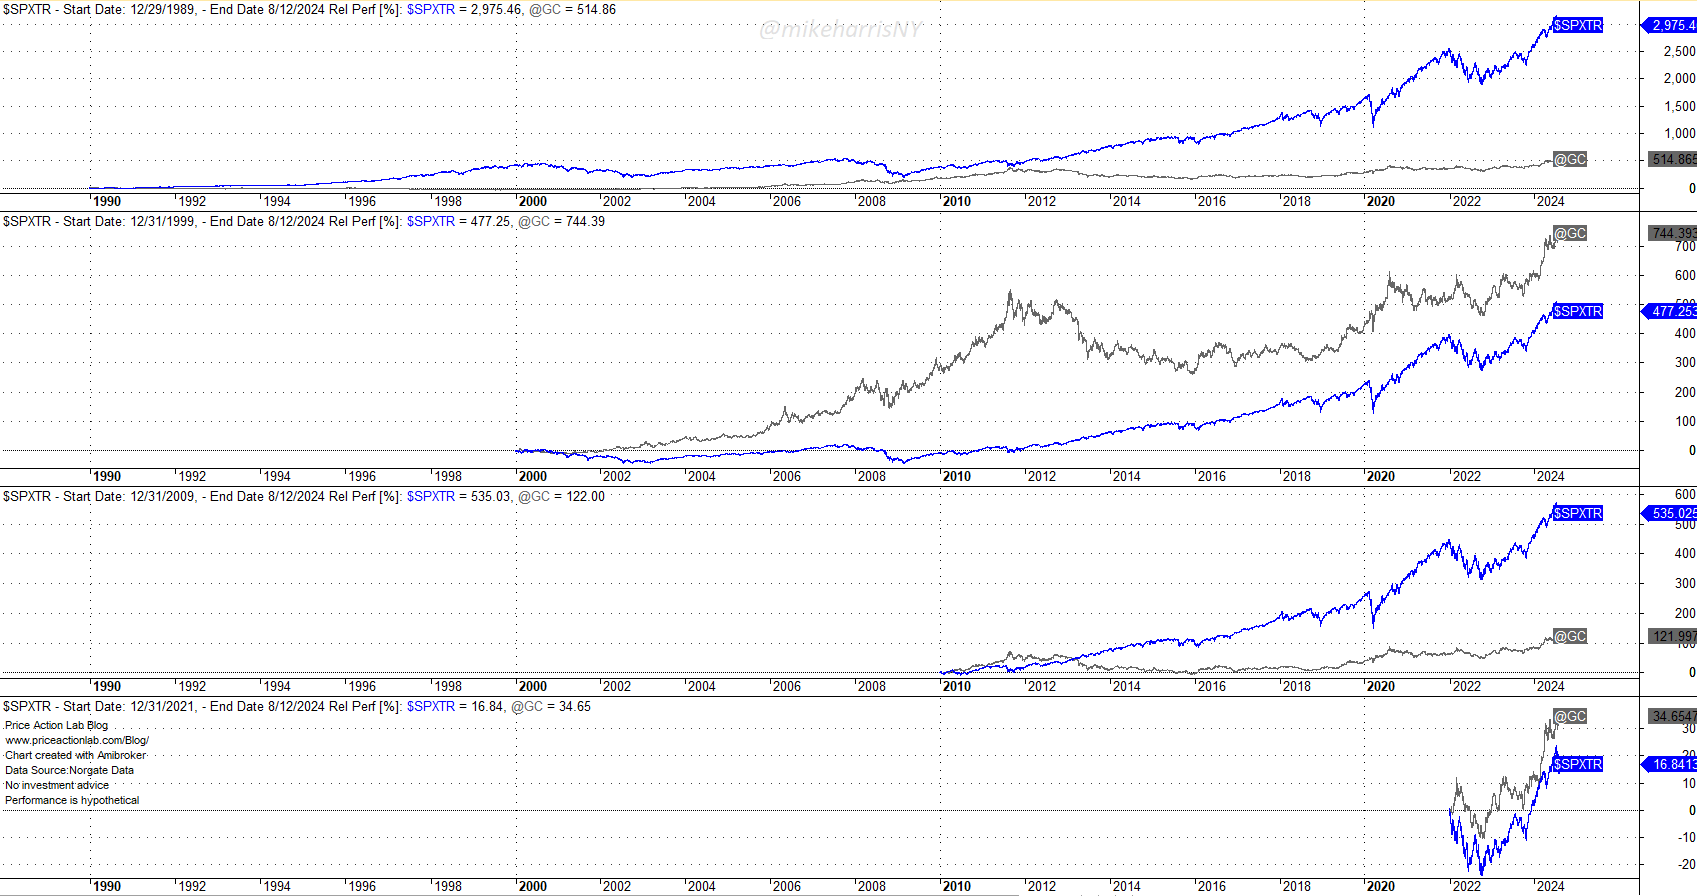
Since 2010, the S&P 500 index total return has outperformed gold by about 4.5, but since 2022, gold has outperformed stocks by about 2.
The above chart clearly shows that gold’s performance relative to stocks is dependent on the look-back period. The different look-back periods shown reflect different market regimes: the strong 1990s equities uptrend, the subsequent dot-com bust, quantitative easing, and the recent high inflation period.
Therefore, as is always the case in markets and finance in general, the selection of assets for use in strategic allocations heavily depends on forecasts about the regime’s nature. Relying on long-term back-tests that average over many different regimes can easily cause Type-I and Type-II errors, the acceptance, or rejection of an asset, or strategic allocation in general.
If we look at the difference between the S&P 500 total return and the gold return for 3 and 7-year periods, this is what we get:
Difference between the S&P 500 total return and gold return for 3 and 7 year rolling periods (Price Action Lab Blog – Norgate Data)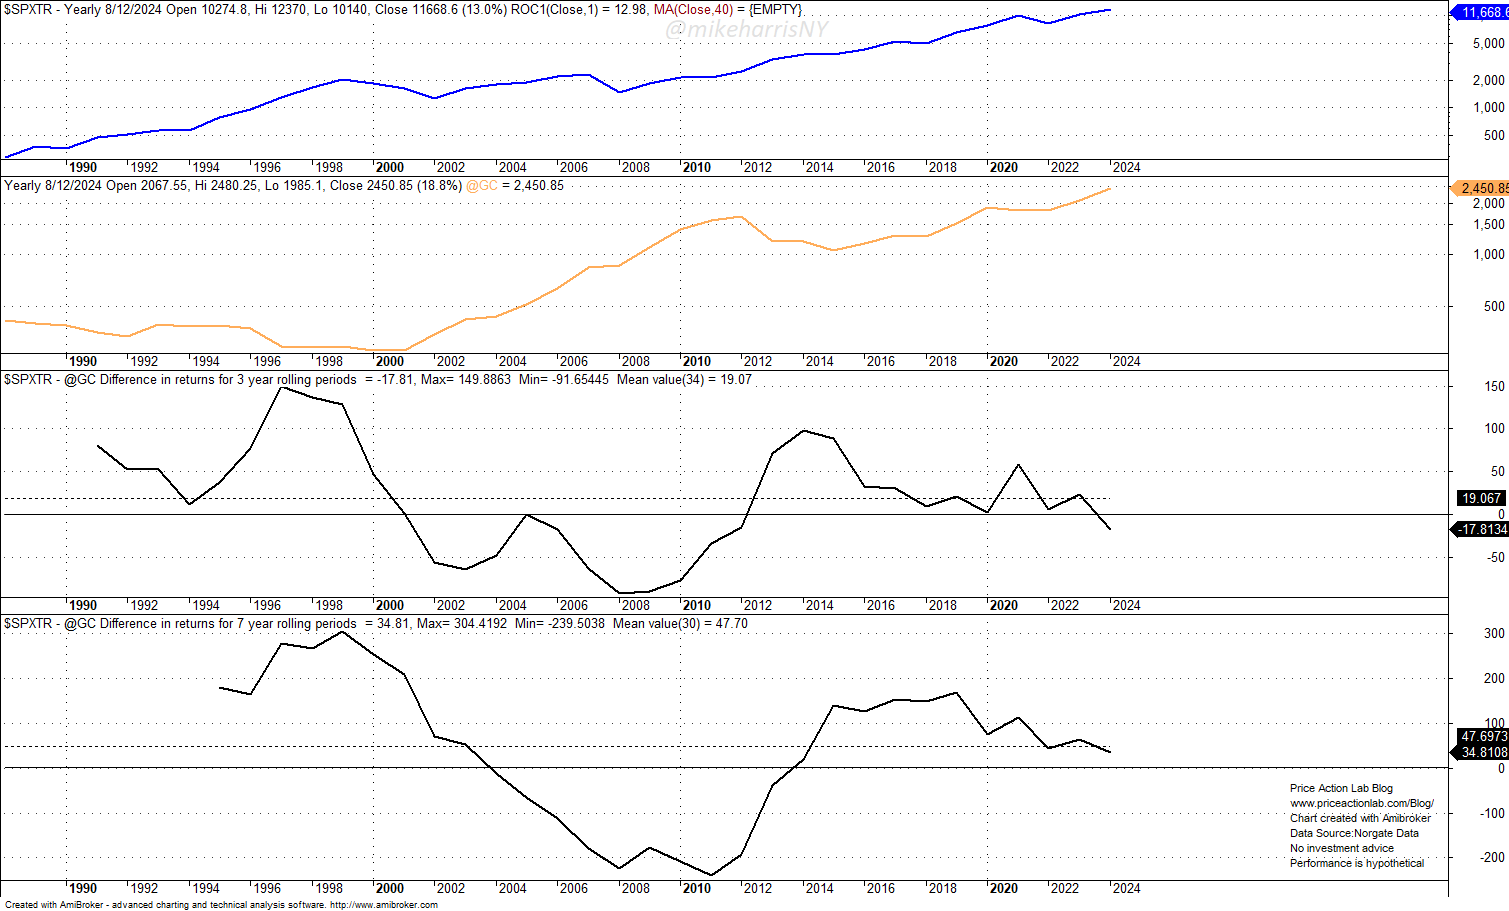
For an extended period from the early 2000s to the early 2010s, both the 3-year and 7-year rolling differences in returns have been negative, meaning that gold outperformed. The mean 3-year outperformance of stocks was 19%, while the mean 7-year outperformance was about 48%.
Gold as a replacement for bonds in a 60/40 portfolio
The results below are based on back-tests and involve annual rebalancing. The back-test period spans from January 2, 1990, to August 12, 2024. For bonds, we used the S&P US Treasury Bond Total Return Index. For stocks, we used the S&P 500 Total Return Index. For gold, we used the London PM spot fix.
| 60/40 Stocks/Bonds | 60/40 Stocks/gold | |
| Annualized Return | 8.4% | 9.2% |
| Maximum Drawdown | -31.7% | -35.0% |
| Volatility | 9.9% | 11.8% |
| Sharpe ratio | 0.84 | 0.78 |
| Correlation with Stocks | 0.97 | 0.84 |
| Total Return | 1560% | 1991% |
The 60/40 allocation to stocks and gold has a lower Sharpe ratio. However, it has a higher total return due to a higher annualized return. Naturally, the stock/gold portfolio has a lower correlation with stocks (0.84 versus 0.97 for the stock/bond portfolio).
In mathematical terms, the risk-adjusted performances of the two 60/40 portfolios are statistically indistinguishable. The total return performance difference is significant. It appears that when gold outperforms, it provides a significant boost to strategic allocations. This occurs during bear markets (such as dot-com) or periods of high inflation. Rising geopolitical tensions may add another outperformance dimension to the gold advantage.
Conclusion
The right question to ask is not whether, on average, gold has underperformed equities, but whether it can serve as an alternative in a new regime of increasing economic and geopolitical uncertainty.
We demonstrated with various charts that, depending on market regimes, gold has outperformed stocks, and on average since 1990, a 60/40 portfolio has generated a significantly higher total return as compared to a traditional portfolio in stocks and bonds.
The structure of strategic allocation depends on the forecast. Aligning allocation with market regimes provides maximum performance benefits. In this new regime, it appears, at least for now, that gold has certain advantages over bonds. This may change, and the forecast and portfolio structure will change accordingly, as will the structure of the portfolios.