

The expansion of unrealized losses on yen-denominated bonds is absorbed by the increase in unrealized gains on stocks
When interest rates rise, the price of yen-denominated bonds held by banks falls, creating unrealized losses. Where and how are these unrealized losses recorded in a bank’s financial statements?
Looking at Keiyo Bank’s (8544) financial results for the fiscal year ending March 2026, the treatment of unrealized losses on yen-denominated bonds differs significantly depending on whether they were sold or not. The portion sold is recognized as a loss on the income statement, pushing down core business profit—the business net profit—by 85% from 9.96 billion yen in the previous period to 1.47 billion yen. The portion not sold does not pass through the income statement and is combined with unrealized gains on stocks on the net assets side of the balance sheet. The increase in unrealized losses on yen-denominated bonds over the past year was absorbed by the increase in unrealized gains on stocks.
On the other hand, net income for the period was 15.8 billion yen, a record high. I will verify through calculations while looking at the financial results pages why “unrealized losses on yen-denominated bonds,” “an 85% decrease in core business profit,” and “record high net income” appear in the same financial results. I will explain the terms specific to bank financial statements in the order they appear, using Keiyo Bank’s own materials.
Materials used
Keiyo Bank (Securities Code 8544) “Financial Results for the Fiscal Year Ending March 2026 [Japanese GAAP] (Consolidated),” disclosed on May 12, 2026. The main financial results and the “Financial Results Presentation Materials for the Fiscal Year Ending March 2026” are bound together in one PDF (35 pages in total).
Since this material does not have page numbers printed on the pages, I will provide both the “PDF page number” and the “page number according to the material’s table of contents” in the text.
Keiyo Bank is not under a holding company; the listed company itself is the bank. All figures below are for the bank on a non-consolidated basis. Figures in diagrams are in 100 million yen, while the text and tables use millions of yen as per the material’s units; numbers without units are in millions of yen.
In this article, “yen-denominated bonds” refers to government bonds, municipal bonds, and corporate bonds held by Keiyo Bank. According to the breakdown of securities on page 14 of the PDF, page 12 of the main financial results table of contents, “4. (1) Balance Sheet,” as of the end of March 2026, the bank held 496.4 billion yen in government bonds, 192.4 billion yen in municipal bonds, and 77.6 billion yen in corporate bonds. Compared to the 114.3 billion yen in stocks, this is nearly seven times the scale.
Unrealized losses on yen-denominated bonds appear in three separate places
First, I will show a map of the conclusion.
In Keiyo Bank’s financial results, unrealized losses on yen-denominated bonds appear in the following three places.
The first is yen-denominated bonds that have been sold. At the time of sale, the unrealized loss is finalized as a loss and recorded on the income statement. The second is yen-denominated bonds that have not been sold and are classified as “other securities.” They are evaluated at market value at the end of each period, and the unrealized loss does not pass through the income statement but is recorded in net assets on the balance sheet. The third is bonds such as those “held-to-maturity” intended to be held until maturity, where unrealized losses are recorded neither on the income statement nor in net assets.
Figure 1 illustrates the first case, and Figure 2 illustrates the second. First, let’s look at the overall picture of the income statement in Figure 1.
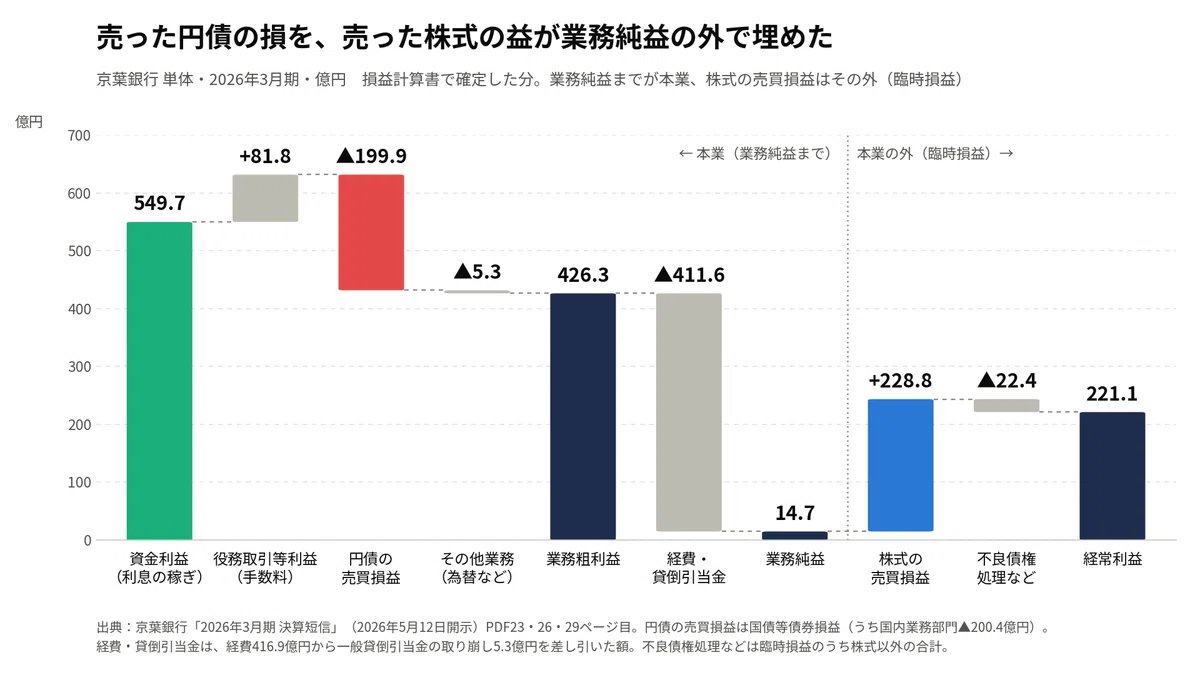
Adding and subtracting from left to right results in ordinary profit. Starting from green fund profit (interest earnings), it is significantly reduced by red yen-denominated bond trading gains/losses, and the business net profit, which is the core business profit, falls to 1.47 billion yen. To the right of the dotted line, outside of core business, blue stock trading gains/losses are added, and ordinary profit returns to 22.11 billion yen.
Below, I will verify which figures from the financial results come from each bar in this diagram.
A bank’s income statement is arranged differently from that of a general company
First, let’s look at the official accounting income statement. It is on page 16 of the PDF, page 14 of the main financial results table of contents, “4. (2) Income Statement.”
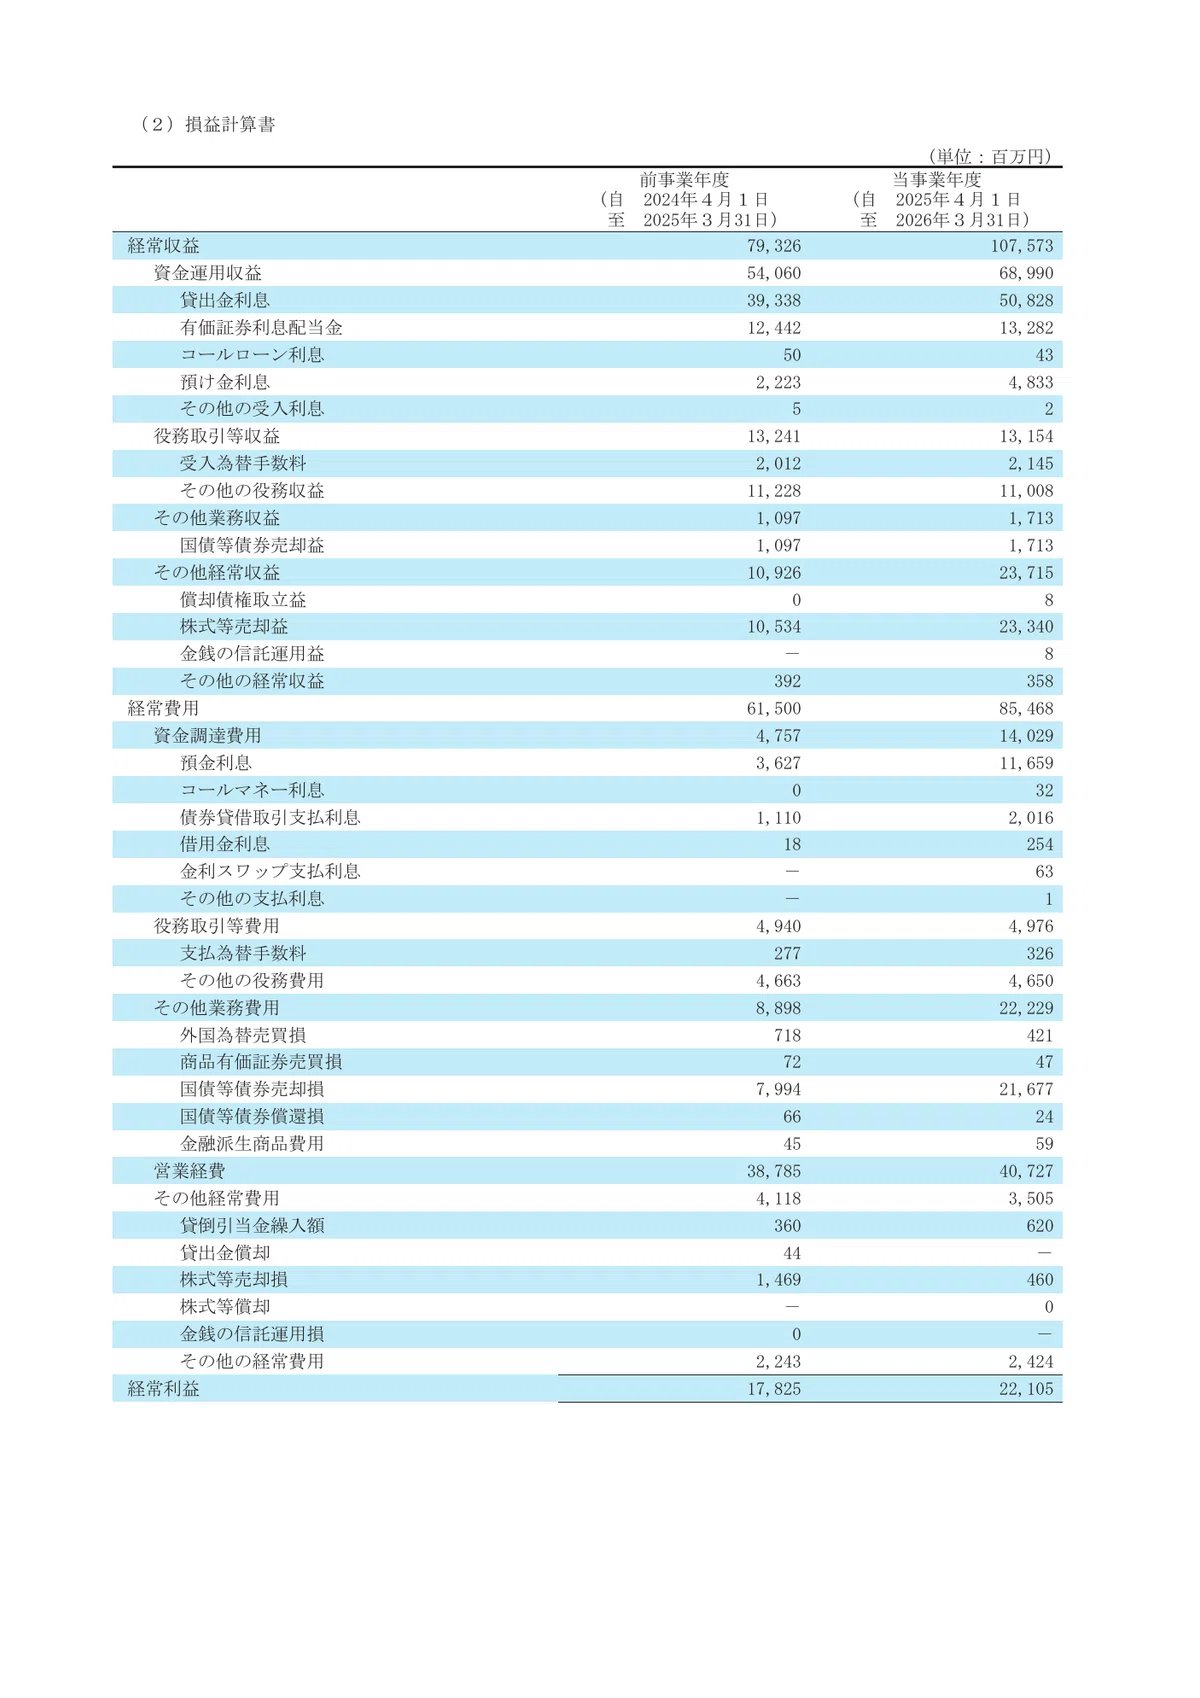
The income statements of general companies are arranged in stages: “Net Sales → Gross Profit → Operating Income.” Banks do not follow this; they list revenues (ordinary income) in the top half and expenses (ordinary expenses) by category in the bottom half, simply calculating the difference as ordinary profit at the end.
Revenues and expenses are paired in the following four groups.
Revenue Item Expense Item Content Fund Operation Revenue 68,990 Fund Procurement Expense 14,029 Interest received from loans and bonds, and interest paid on deposits, etc. Service Transaction Revenue 13,154 Service Transaction Expense 4,976 Transfer fees, investment trust sales commissions, etc. Other Business Revenue 1,713 Other Business Expense 22,229 Mostly gains/losses from trading bonds such as government bonds Other Ordinary Revenue 23,715 Other Ordinary Expense 3,505 Gains/losses from stock trading, provision for loan losses, etc.
What is important to note here is that yen bonds and stocks are placed in different categories. The loss on sale of government bonds, etc., of 21,677 is included in “Other Business Expenses,” while the gain on sale of stocks, etc., of 23,340 is included in “Other Ordinary Revenue.” This difference is the reason behind the “record profits despite an 85% drop in core business profit” situation.
Tiered profits and terminology used by banks
With this income statement as it is, it is difficult to see how much the core business has earned. Therefore, banks rearrange the items to create and disclose their own tiered profit figures. This can be found on page 26 of the PDF, or page 5 of the financial results briefing materials, under “II-1 Profit and Loss Status (Non-consolidated).” Each bank is assigned a number (No.).
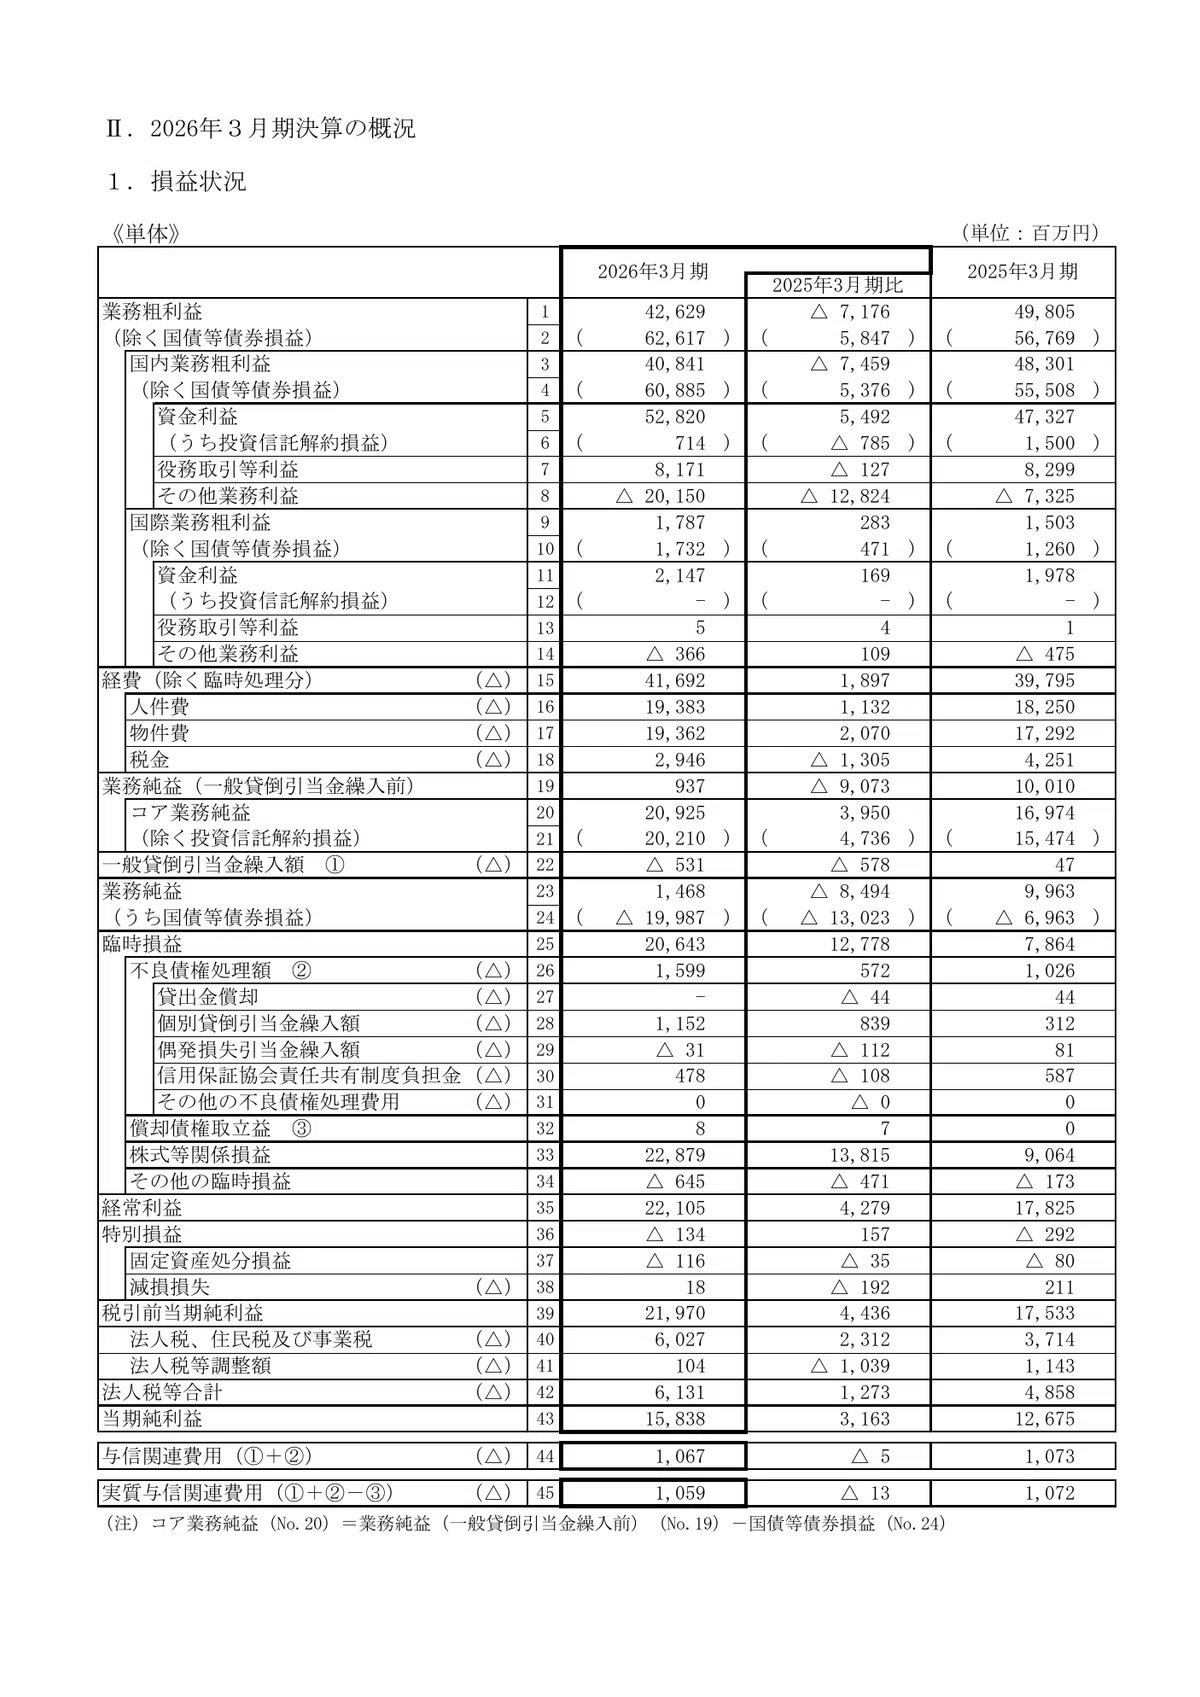
I will explain the terms appearing in this table in order from the top.
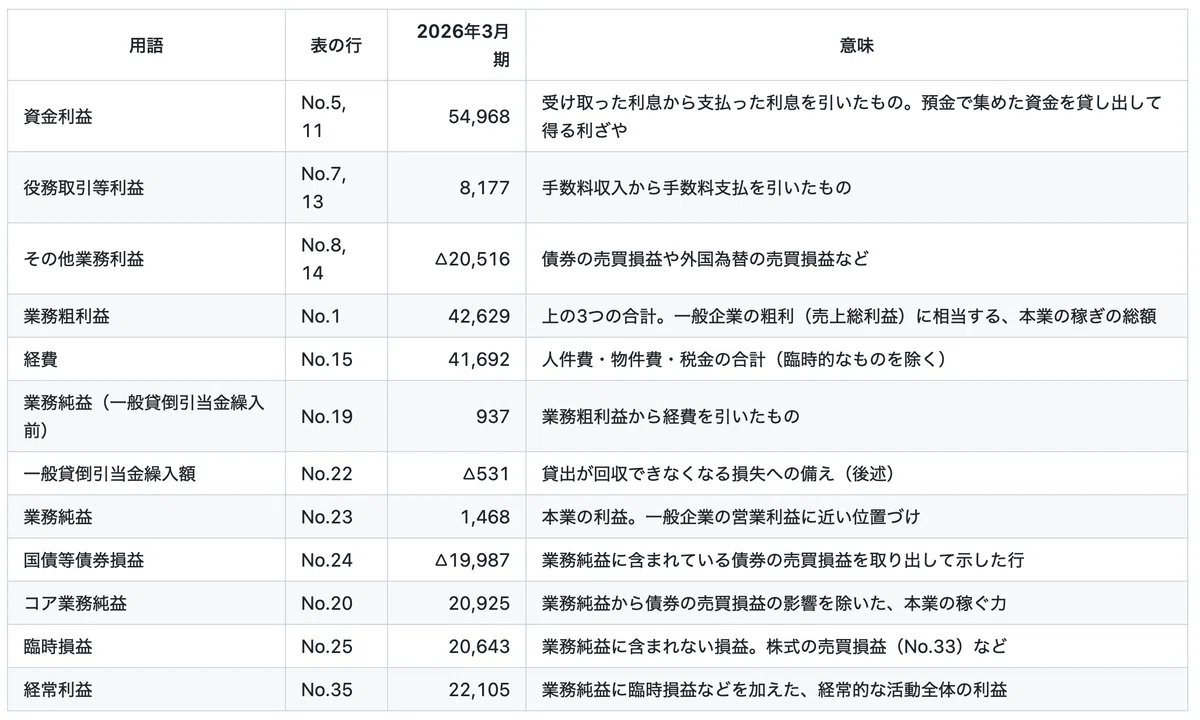
Fund profit, service transaction profit, and other business profit are divided into domestic and international operations in the table. The figures above are the totals for both, which are listed on page 23 of the PDF (page 2 of the financial results briefing materials).
General provision for loan losses is money set aside to prepare for the possibility that a portion of loans will become uncollectible in the future, specifically the portion not tied to a specific client. Increasing this provision is an expense, and reversing it is a profit. Keiyo Bank’s reversal amount for this term is -531, where the minus sign indicates a reversal. Looking at “3. Status of Allowance for Loan Losses” on page 33 of the PDF (page 12 of the financial results briefing materials), the balance of the general provision for loan losses has decreased from 8,265 to 7,734, exactly 531. For this reason, the business net profit of 1,468 is higher than the 937 before the provision.
The formula for core business net profit is shown in the notes below the table.
(Note) Core business net profit (No. 20) = Business net profit (before general provision for loan losses) (No. 19) – Gains/losses on government bonds, etc. (No. 24)
Calculating this, 937 – (-19,987) = 20,924. The difference of 1 from the disclosed value of 20,925 is due to rounding down amounts less than one million yen.
Gains and losses from bond trading fluctuate significantly year by year due to interest rate movements and the bank’s selling decisions. The idea behind this indicator is that by excluding these, one can see the true strength of the core business, such as lending and fees.
Calculating business gross profit
Now that the terminology is clear, let’s assemble the business gross profit. This is on page 23 of the PDF, page 2 of the financial results briefing materials, “I-1 Profit and Loss Status (Non-consolidated).”
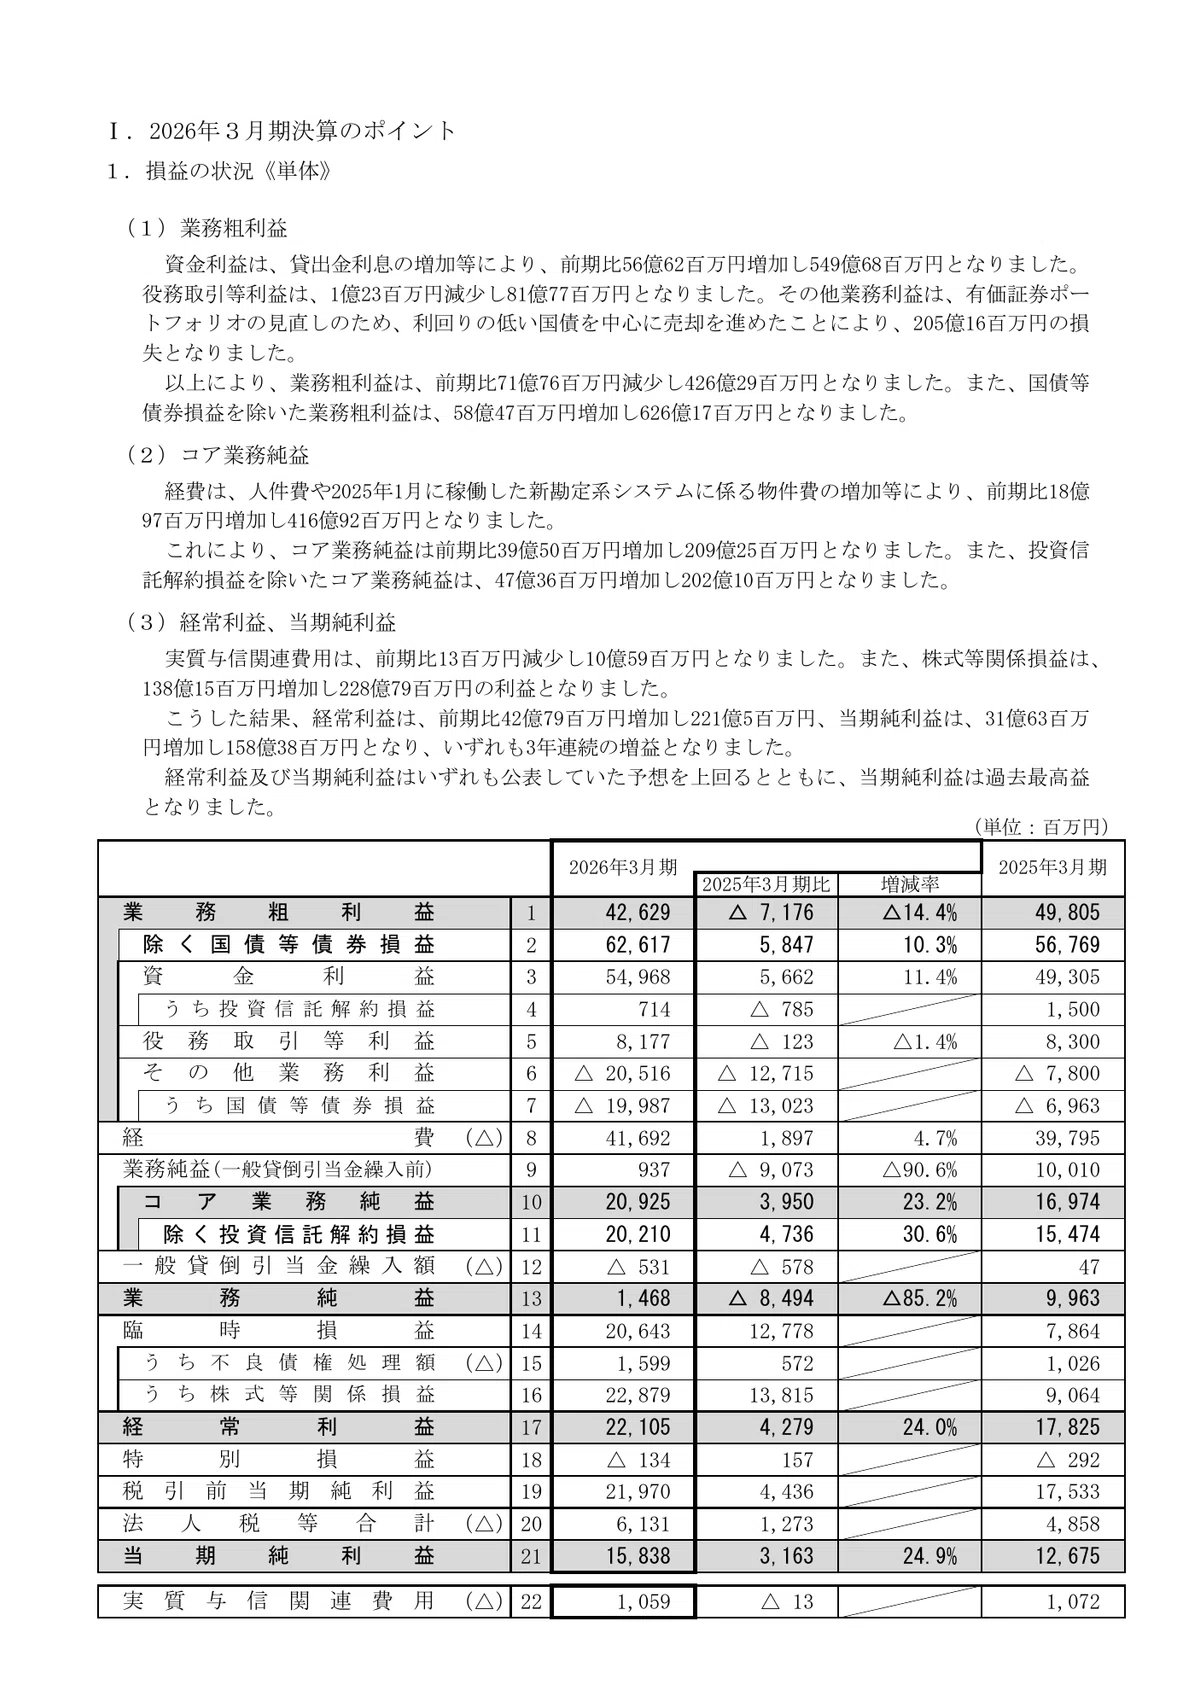
Fund profit 54,968 + Service transaction profit 8,177 + Other business profit -20,516 = 42,629. This matches the disclosed value. The first five bars from the left in Figure 1 represent this calculation (other business profit is depicted separately as -19,987 for yen bond trading gains/losses and -529 for foreign exchange, etc.).
What catches the eye here is that the business gross profit of 42,629 is lower than the fund profit of 54,968. Even though interest earnings, which are the core of the business, are 55 billion yen, the total earnings are 12.3 billion yen less than that. This is because other business profit is significantly negative due to losses on the sale of yen bonds.
Core business: Interest earnings have increased
Before getting into the topic of yen bonds, I will confirm how the interest rate hike affected the core business.
Net interest income increased by 5.7 billion yen compared to the previous fiscal year, a rate of 11.4%. Checking the details in the income statement on page 16 of the PDF, while interest on loans increased by 11.5 billion yen from 39,338 to 50,828, interest on deposits also increased by 8 billion yen from 3,627 to 11,659. This means that the increase in interest income from loans exceeded the increase in interest expenses on deposits.
Looking at yields, this relationship becomes clear. Please see the domestic business segment under ‘3. Interest Margins (Non-consolidated)’ on page 7 of the table of contents of the financial results presentation materials, which is page 28 of the PDF.
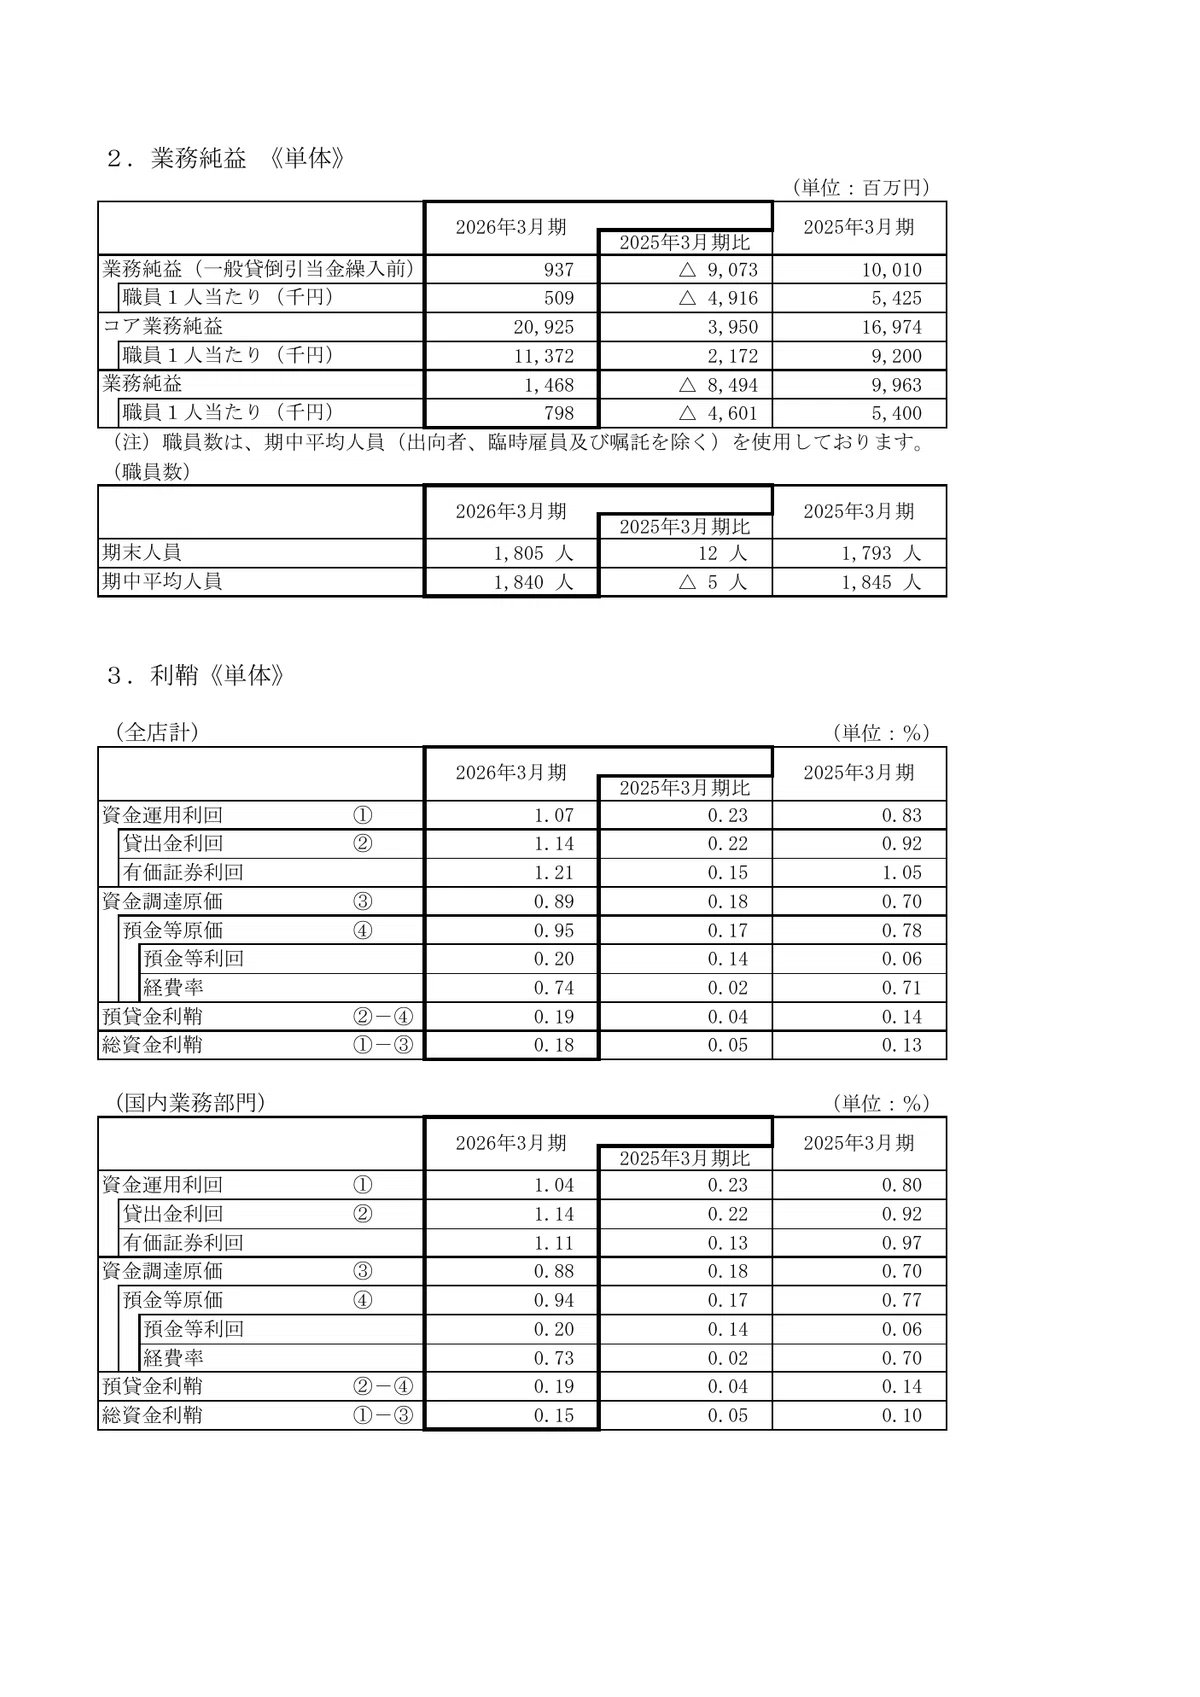
Domestic business segment Fiscal year ending March 2026 Fiscal year ending March 2025 Loan yield 1.14% 0.92% Deposit etc. yield 0.20% 0.06%
Yield is a figure indicating what percentage of interest was received (or paid) relative to the average balance. The loan yield rose by 0.22 percentage points, and the yield on deposits etc. rose by 0.14 percentage points. The extent to which the rise in interest rates could be passed on to loan interest rates was greater than the extent to which deposit interest rates were raised. As a result, core net business profit increased by 23.2% from 16,974 to 20,925.
Yen-denominated bonds sold: Losses are finalized on the income statement
When interest rates rise, the price of yen-denominated bonds already held by banks falls. Because bonds have fixed interest rates at the time of issuance, if bonds with higher interest rates appear later, older bonds with lower interest rates become relatively less attractive.
Keiyo Bank sold these yen-denominated bonds. On page 23 of the PDF, the bank explains that ‘in order to review our securities portfolio, we proceeded with the sale of bonds, mainly Japanese government bonds with low yields.’ If you sell yen-denominated bonds whose prices have fallen, a loss on sale will occur, but if you use the proceeds from the sale to buy bonds with higher yields, future interest income will increase. It is a decision to finalize unrealized losses first and secure future earnings.
Almost the entire amount of the loss occurred in the domestic business segment. In the table on page 26 of the PDF, the difference between the domestic business gross profit of 40,841 and the domestic business gross profit excluding gains/losses on bonds such as Japanese government bonds of 60,885 is -20,044.
The breakdown of the sales is on page 29 of the PDF, in ‘4. Gains/Losses on Securities (Non-consolidated)’ on page 8 of the table of contents of the financial results presentation materials.
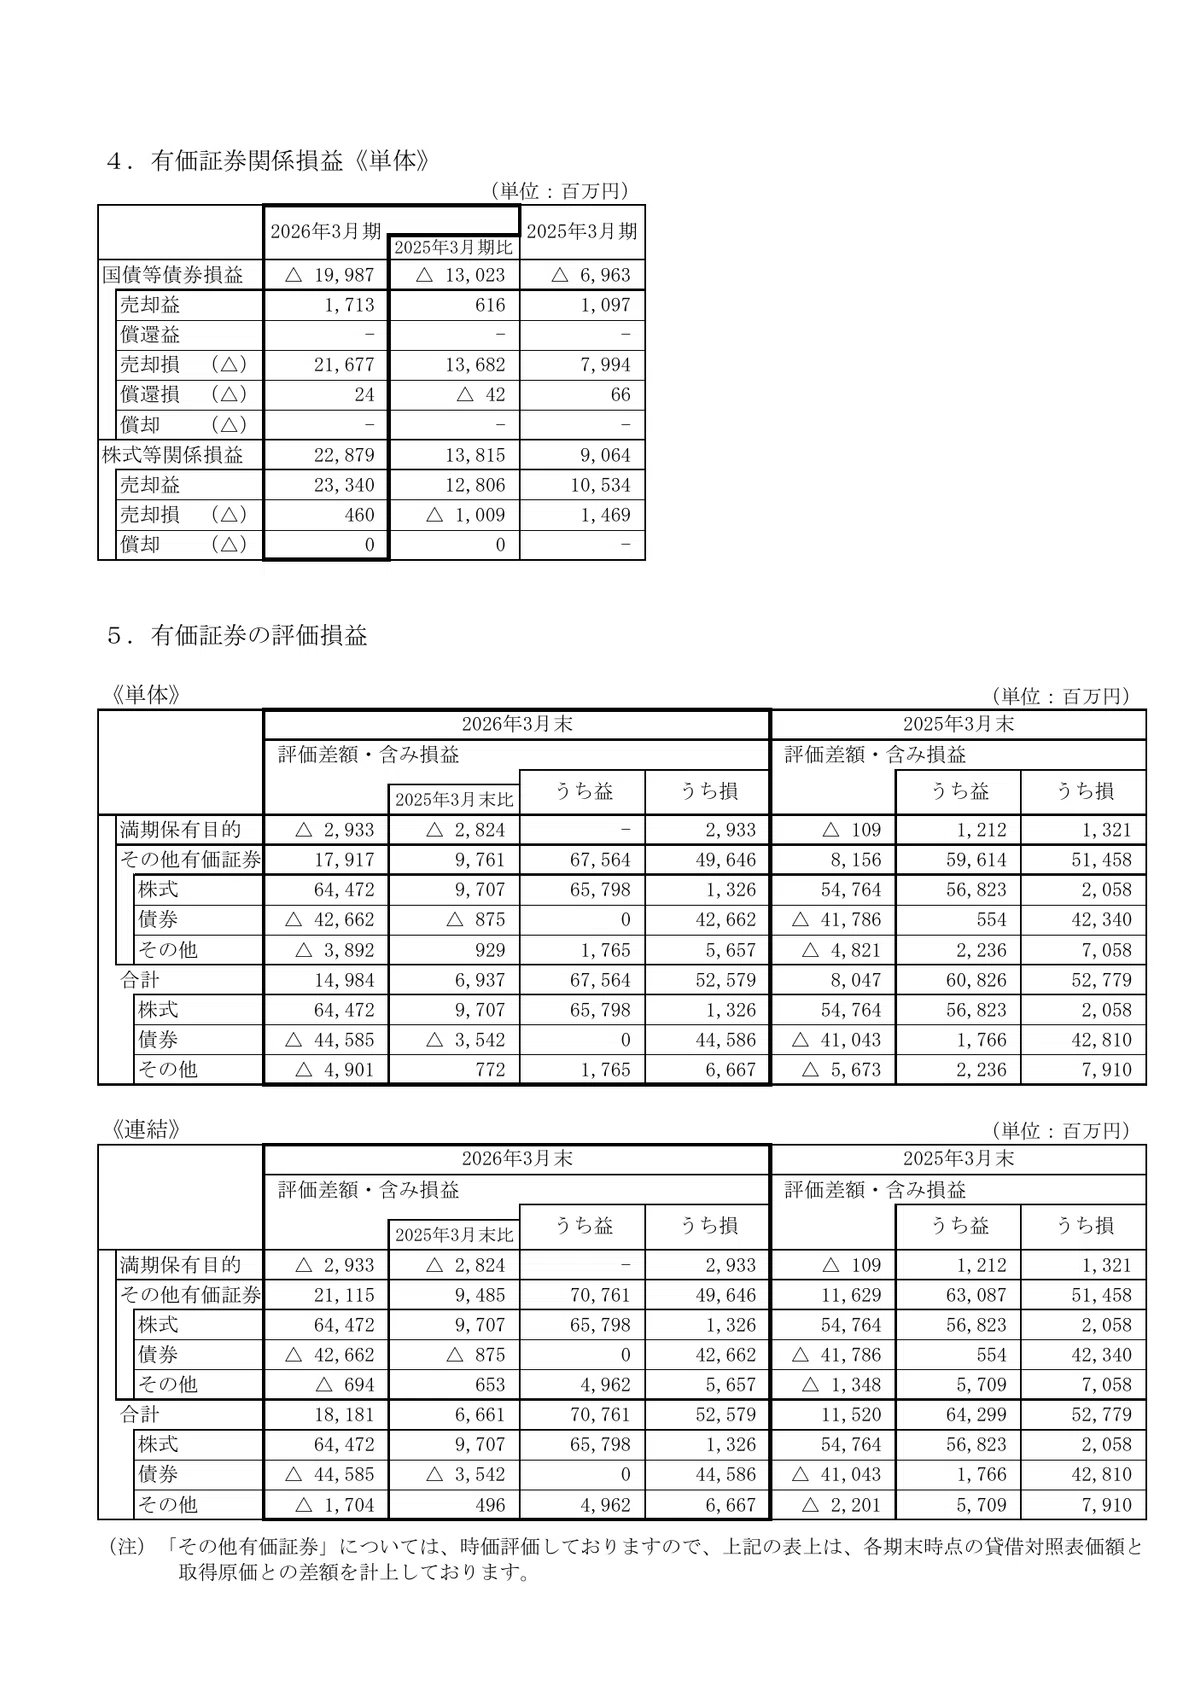
Gains/losses on bonds such as Japanese government bonds Fiscal year ending March 2026 Fiscal year ending March 2025 Gain on sale 1,713 1,097 Loss on sale 21,677 7,994 Loss on redemption 24 6 Total -19,987 -6,963
This -19,987 pushed down the business gross profit through other business profits and reduced the net business profit accordingly. This is why the net business profit fell from 9,963 in the previous fiscal year to 1,468.
To get a sense of the scale, I will compare it with the core net business profit. 19,987 ÷ 20,925 = 95.5%. This is a calculation where an amount equivalent to almost the entire amount earned from the core business was allocated to the replacement of yen-denominated bonds.
Stocks sold: Becomes profit outside of net business profit
On the other hand, Keiyo Bank also sold the stocks it held and realized the appreciation from the time of acquisition as profit. In the same table on page 29 of the PDF, the gain/loss on stocks etc. is 22,879 (gain on sale 23,340, loss on sale 460).
As I saw at the beginning, the gain/loss on the sale of stocks enters ‘other ordinary income/expenses’ on the income statement and is not included in business gross profit or net business profit. In the table of tiered profits, it is recorded under extraordinary gains/losses (No. 25) below net business profit.
The part to the right of the dotted line in Figure 1 is this section. The gain/loss on the sale of stocks of 22.88 billion yen is added to the net business profit of 1.47 billion yen, and after deducting expenses such as the disposal of non-performing loans, the ordinary profit becomes 22.1 billion yen. This is 15.1 times the net business profit. The gain/loss on stocks etc. of 22.88 billion yen is 1.14 times the gain/loss on bonds such as Japanese government bonds of -19.99 billion yen, and the profit from the sold stocks almost covers the loss from the sold yen-denominated bonds. The record-high net income of 15.8 billion yen for the current fiscal year is the result of following this path.
Yen-denominated bonds not sold: Unrealized losses are in net assets and are combined with unrealized gains on stocks
So, how is the decline in value of yen-denominated bonds that have not been sold accounted for?
Among the securities held by Keiyo Bank, those classified as ‘other securities’ are evaluated at market value at the end of each period. In the valuation gain/loss table on page 29 of the PDF, there is a note stating, ‘Regarding other securities, we are performing market value evaluation, so in the table above, we are recording the difference between the balance sheet amount at the end of each period and the acquisition cost.’ The difference between this market value and the acquisition cost is the unrealized gain/loss.
Unrealized gains and losses do not pass through the income statement. After adjusting for taxes, they are recorded in the net assets section of the balance sheet as ‘valuation difference on available-for-sale securities.’ On page 15 of the PDF, or page 13 above the table of contents of the financial results summary itself, under ‘4. (1) Balance Sheet,’ this amount in the net assets section has increased from 5,624 at the end of the previous fiscal year to 12,312. This classification and treatment are stipulated in Accounting Standards Board of Japan (ASBJ) Statement No. 10, ‘Accounting Standard for Financial Instruments.’
What is important here is that this single line in net assets is the result of combining the unrealized losses on yen bonds and the unrealized gains on stocks. The valuation gain/loss table (page 29 of the PDF, ‘5. Valuation Gain/Loss on Securities (Non-consolidated)’) shows this broken down into stocks, bonds, and others. Figure 2 shows the net change from the end of the previous fiscal year to the end of the current fiscal year.
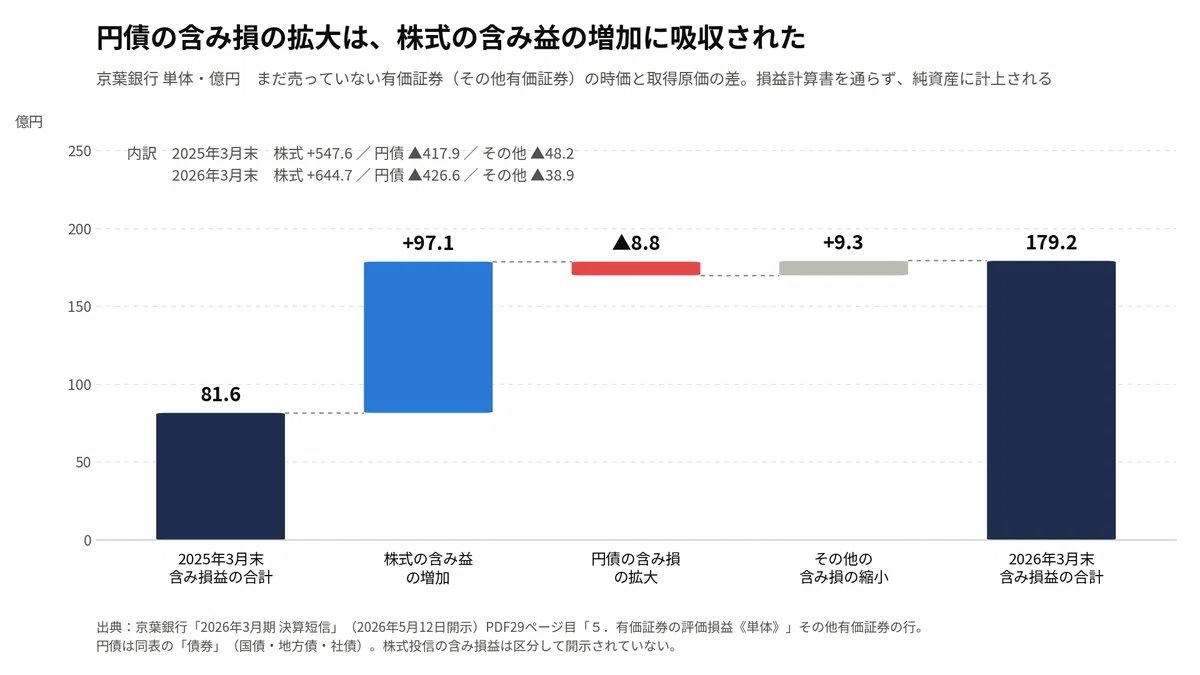
Unrealized losses on yen bonds expanded by 880 million yen, from 41.79 billion yen to 42.66 billion yen. In the same year, unrealized gains on stocks increased by 9.71 billion yen, from 54.76 billion yen to 64.47 billion yen. The expansion of unrealized losses on yen bonds was absorbed by the increase in unrealized gains on stocks, and the total unrealized gain/loss actually more than doubled, from 8.16 billion yen to 17.92 billion yen.
The reason the expansion of unrealized losses on yen bonds was limited to 880 million yen is that this figure is after disposing of yen bonds carrying unrealized losses by realizing a loss on sale of 21.6 billion yen this term. If they had not been sold and were held, that portion of the loss would have remained as an unrealized loss. The portion sold went to the income statement in Figure 1, and the portion not sold went to net assets in Figure 2. The same unrealized loss on yen bonds has different destinations depending on whether or not they were sold.
Unrealized gains on stocks increased due to rising stock prices, even while realizing 23.3 billion yen in gains on sales this term. Note that Keiyo Bank’s valuation gain/loss table uses three categories: stocks, bonds, and others, and unrealized gains/losses on stock investment trusts are not shown separately. Therefore, this article confirms the absorption relationship using the stock figures. In the ‘others’ category, unrealized losses shrank by 930 million yen, from 4.82 billion yen to 3.89 billion yen.
Bonds held to maturity, etc.: Unrealized losses do not appear on the balance sheet either
There is another type of unrealized loss that is recorded neither on the income statement nor in net assets. Bonds classified as ‘held-to-maturity’ with the premise of holding them until maturity are not revalued at market price, so even if their value drops, it is not reflected in the balance sheet amount (ASBJ Statement No. 10).
The first line of Keiyo Bank’s valuation gain/loss table is for this, and unrealized losses on held-to-maturity bonds increased from 110 million yen at the end of the previous fiscal year to 2.93 billion yen. Although the scale is small, it is an unrealized loss that appears neither on the income statement nor in net assets, and can only be confirmed through disclosures like this valuation gain/loss table.
What can be read
Following Keiyo Bank’s financial results summary, unrealized losses on yen bonds were handled in three ways.
The loss on sold yen bonds was finalized as a 19.99 billion yen loss on bonds including government bonds on the income statement, pushing down core business profit, which is the profit from main operations, by 85%. The 42.66 billion yen in unrealized losses on unsold yen bonds (available-for-sale securities) did not pass through the income statement and was combined with unrealized gains on stocks in net assets. The 2.93 billion yen in unrealized losses on held-to-maturity bonds was not recorded in either.
And this past year, stocks supported yen bonds in both places. On the income statement, the 22.88 billion yen gain on the sale of stocks covered the loss on the sale of yen bonds. In net assets, the 9.71 billion yen increase in unrealized gains on stocks absorbed the 880 million yen expansion in unrealized losses on yen bonds. The record-high profit does not indicate that the unrealized losses on yen bonds have disappeared, but rather that they are being absorbed by stocks.
The clue for the future is the relationship between the 42.7 billion yen in unrealized losses on yen bonds remaining in net assets and the 64.5 billion yen in unrealized gains on stocks. The former will expand if interest rates rise, and the latter will shrink if stock prices fall. The unrealized losses on yen bonds are equivalent to about two years’ worth of this term’s core business profit of 20.9 billion yen.