Close Menu
Fund Focus News
    Facebook X (Twitter) Instagram
    Trending
    • Types of Mutual Funds That Work Best for Monthly SIPs Under Rs 5,000
    • Short Term Parking Avenue – The HinduBusinessLine
    • How SEBI’s life cycle funds could simplify your retirement planning
    • SEBI allows intraday borrowing by mutual funds to manage redemption payouts
    • SEBI sets rules for mutual fund intraday borrowing, shields investors from costs
    • Sebi issues guidelines for mutual funds on intraday borrowing
    • Best flexi cap mutual funds to invest in March 2026
    • 4 Top-Performing Multisector Bond Funds
    Facebook X (Twitter) Instagram
    Fund Focus News
    • Home
    • Bonds
    • ETFs
    • Funds
    • Investments
    • Mutual Funds
    • Property Investments
    • SIP
    Fund Focus News
    Home»ETFs»Bitcoin Key Indicator Turns Bullish As Spot ETFs Record $2.1 Billion Weekly Inflow: New ATH Imminent?
    ETFs

    Bitcoin Key Indicator Turns Bullish As Spot ETFs Record $2.1 Billion Weekly Inflow: New ATH Imminent?

    October 22, 2024


    A crucial momentum indicator for Bitcoin (BTC) has turned positive, as the premier cryptocurrency attracted more than $2.1 billion in spot exchange-traded fund (ETF) weekly net inflows.

    New Bitcoin All-Time-High In Sight?

    Bitcoin could be heading to a new all-time high (ATH) price, as the moving average convergence divergence (MACD) histogram has turned positive on the weekly chart for the first time since April 2024.

    For the uninitiated, the MACD histogram is a crucial momentum indicator widely used to gauge the future price of the underlying asset. The indicator helps traders identify shifts in momentum, with positive values suggesting upward momentum and negative values indicating downward momentum. 

    The MACD is calculated by subtracting Bitcoin’s 26-week moving average from its 12-week average. Further, a signal line is created by averaging the MACD over nine weeks, and the difference between the MACD and the signal line is displayed as a histogram. 

    Notably, the MACD histogram’s height reflects the trend’s strength, aiding in determining potential buy or sell points in the market. In the chart below, the MACD is sprouting after remaining in the red since April 2024.

    Bitcoin MACD
    BTC MACD has turned green on the weekly chart | Source: BTCUSDT on TradingView.com

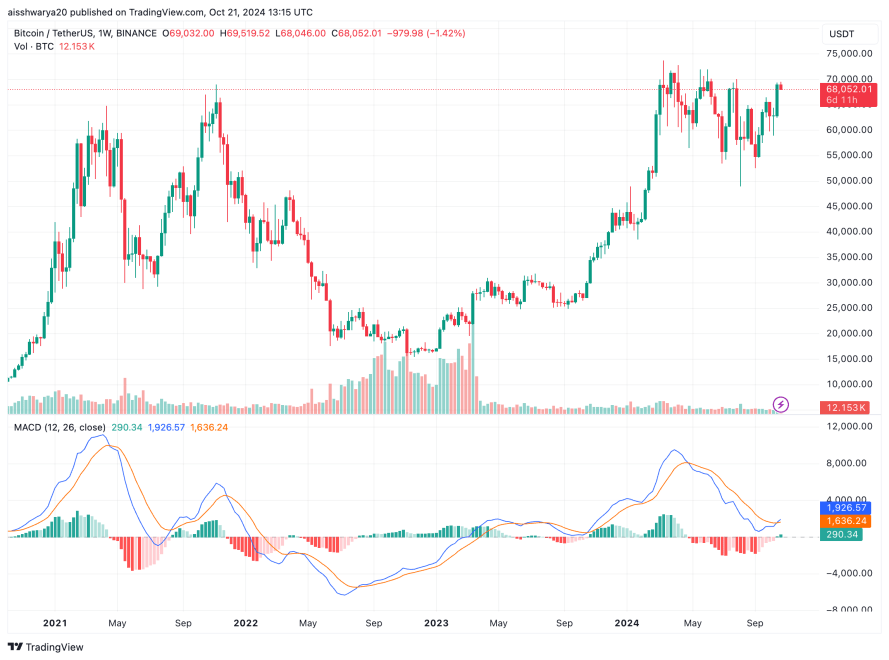
    In BTC’s context, the recent positive change in the MACD histogram indicates a growing buying interest in the market. It suggests that Bitcoin’s short-term price trend is gaining strength relative to its longer-term trend, signaling potential upward movement beyond its ATH value of $73,737 in March 2024.

    The MACD turning bullish aligns well with other positive macroeconomic developments, including the US Federal Reserve’s (Fed) decision to slash key interest rates to stimulate business spending. Crypto analysts predict that further cuts in interest rates will give BTC the required ammunition to rally in Q4 2024.

    Spot BTC ETFs Post $2.1 Billion In Weekly Net Inflows

    Another factor painting a bullish picture for the leading digital asset is the return of strong positive weekly inflows into US-based spot BTC ETFs.

    According to data from SoSoValue, total weekly net inflows in spot BTC ETFs for the week ending October 18 were $2.13 billion. This marks the highest total weekly net inflows since $2.6 billion in March 2024, when BTC made a new ATH of more than $73,000. 

    As of October 18, the cumulative net inflow of US spot BTC ETFs stands at $20.94 billion, with total net assets of $66 billion, worth almost 4.9% of Bitcoin’s total market cap.

    Since their approval by the US Securities and Exchange Commission (SEC) earlier this year, many institutional investors have gravitated toward Bitcoin ETFs.

    Wall Street titan Morgan Stanley recently revealed it had $272 million in BTC ETF holdings, signifying about 2% of their total assets under management.

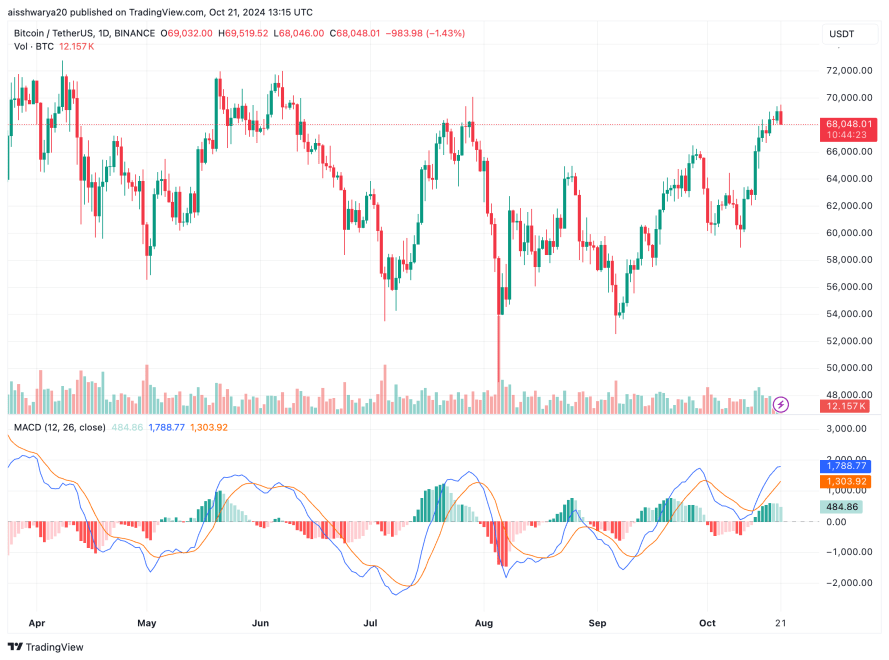
    However, declining interest in Bitcoin – evident through low search volumes for Bitcoin keywords on Google – suggests that retail participants are still reluctant to invest in BTC due to its perceived volatility. BTC trades at $68,048 at press time, down 1.2% in the past 24 hours.

    bitcoin
    BTC trades at $68,048 on the daily chart | Source: BTCUSDT on TradingView.com

    Featured Image from Unsplash.com, Charts from TradingView.com


    Source link

    Share. Facebook Twitter Pinterest LinkedIn Tumblr Telegram Email

    Related Posts

    Comparing Impacts on ETFs from Ukraine and Iran Conflicts

    March 13, 2026

    Ethereum ETFs Climb as Bitcoin Funds Add $53.8M

    March 13, 2026

    SOXL vs. SSO: What Type of Investor Should Consider These Leveraged ETFs?

    March 13, 2026
    Leave A Reply Cancel Reply

    Top Posts

    Fisher Investments Review 2026 – Forbes Advisor

    March 12, 2026

    The Shifting Landscape of Art Investment and the Rise of Accessibility: The London Art Exchange

    September 11, 2023

    Charlie Cobham: The Art Broker Extraordinaire Maximizing Returns for High Net Worth Clients

    February 12, 2024

    The Unyielding Resilience of the Art Market: A Historical and Contemporary Perspective

    November 19, 2023
    Don't Miss
    Mutual Funds

    Types of Mutual Funds That Work Best for Monthly SIPs Under Rs 5,000

    March 14, 2026

    Investing doesn’t always require a large capital base. In fact, many investors in India begin…

    Short Term Parking Avenue – The HinduBusinessLine

    March 14, 2026

    How SEBI’s life cycle funds could simplify your retirement planning

    March 14, 2026

    SEBI allows intraday borrowing by mutual funds to manage redemption payouts

    March 14, 2026
    Stay In Touch
    • Facebook
    • Twitter
    • Pinterest
    • Instagram
    • YouTube
    • Vimeo
    EDITOR'S PICK

    Dover issuing $3 million in bonds for bank building purchase

    August 6, 2024

    UK venture capital funds launched since 2020 outperform US funds

    December 1, 2025

    Stock Market Correction: 2 Unstoppable Vanguard ETFs to Buy With $800 During the S&P 500 Sell-Off

    August 9, 2024
    Our Picks

    Types of Mutual Funds That Work Best for Monthly SIPs Under Rs 5,000

    March 14, 2026

    Short Term Parking Avenue – The HinduBusinessLine

    March 14, 2026

    How SEBI’s life cycle funds could simplify your retirement planning

    March 14, 2026
    Most Popular

    🔥Juve target Chukwuemeka, Inter raise funds, Elmas bid in play 🤑

    August 20, 2025

    💵 Libra responds after Flamengo takes legal action and ‘freezes’ funds

    September 26, 2025

    ₹10,000 monthly SIP in this mutual fund has grown to ₹1.52 crore in 22 years

    September 17, 2025
    © 2026 Fund Focus News
    • Get In Touch
    • Privacy Policy
    • Terms and Conditions

    Type above and press Enter to search. Press Esc to cancel.