
")
G0d4ather
This article on the Vanguard Mega Cap Value Index Fund ETF Shares (NYSEARCA:MGV) is a follow-up to this week’s earlier article on the Vanguard S&P 500 ETF (VOO): see The S&P 500 Should Be The Cornerstone Of Your Portfolio. In that article, I argued that the vast majority of ordinary investors would benefit from a well-diversified portfolio built on the foundation of a good low-cost S&P500 ETF (like VOO). In this case, “foundation” means that VOO would be the largest single holding in such a portfolio. I also advised a top-down allocation strategy into various investment categories (see the sample portfolio shown below) in which one possible category is “Sector-Specific ETFs”. This category would likely be home for a “value” ETF like MGV. Today, I will take a closer look at the MGV ETF to see if it makes sense in your portfolio and to see if I should continue to hold it in mine.
| CATEGORY | ALLOCATION |
| S&P 500 | 40% |
| Income/Dividend Growth | 10% |
| Growth/Technology | 25% |
| Sector-Specific ETFs | 5% |
| Speculative Growth | 5% |
| Precious Metals | 5% |
| Cash | 10% |
NOTE: This is a sample portfolio only for the sake of discussion. Yes, I understand that each investor has different “particulars” like age, working/retired, risk tolerance, etc. and, Yes, I understand that “one size does not fit all”. So, please refrain from comments that argue with the allocation percentages shown above … they do not represent my own personal portfolio’s allocation and I seriously doubt they will represent yours. Thank you!
Investment Thesis
In my opinion, the “Sector-Specific ETFs” category shown in the sample portfolio above is available to investors who want to further diversify their portfolios by adding additional weight to specific sectors. In my own portfolio, this category is home to ETFs which are designed to give my portfolio some ballast (for lack of a better word …) when the S&P500 and/or Tech sector suffers a big sell-off. For my own personal portfolio, I have sector-specific ETFs like Consumer Staples (XLP), Defense & Aerospace (FSDAX)(XAR), HealthCare (FHLC) and, yes, some value funds including MGV. During the 2022 Tech bear-market, these funds did exactly what I wanted and expected them to do because they held up comparably well compared to my Tech stocks and funds. The ballast in the portfolio gave me the confidence to double-down on some of my Tech holdings because I considered the 2022 sell-off to be way overblown. It certainly turned out to be exactly that.
With that as background, let’s take a closer look at the MGV ETF. I’ll start with the top holdings.
Top-10 Holdings
The top-10 holdings in the MGV ETF are shown below and were taken directly from Vanguard’s MGV ETF webpage, where you can find more detailed information on the fund:
Vanguard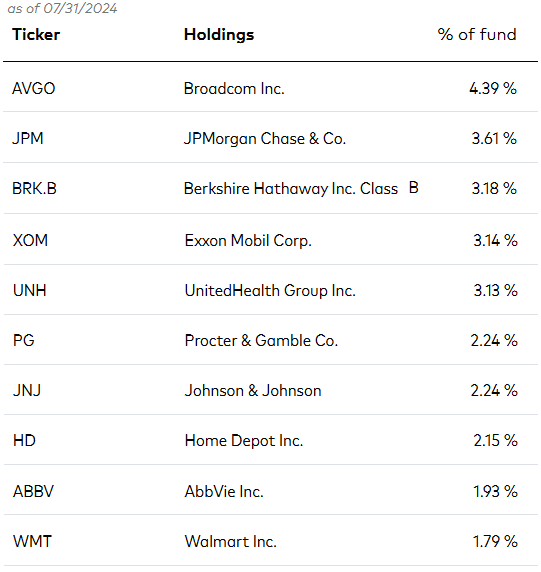
I’m sure many of Seeking Alpha’s value oriented investors will be surprised to see Tech star Broadcom (AVGO) as the #1 holding with a 4.4% weight. After all, by traditional valuation metrics like TTM P/E (70.9x) and forward P/E (35x) Broadcom is likely considered to be “expensive”. So, what does Vanguard management see in the stock to consider it to not only to be a “value”, but to have it be the biggest position in the fund?
First off, Broadcom has been the best dividend growth stock in the entire S&P500 over the past 8-9 years and currently pays $2.10/share (adjusted after the 10:1 split), which equates to a 1.26% yield:
Broadcom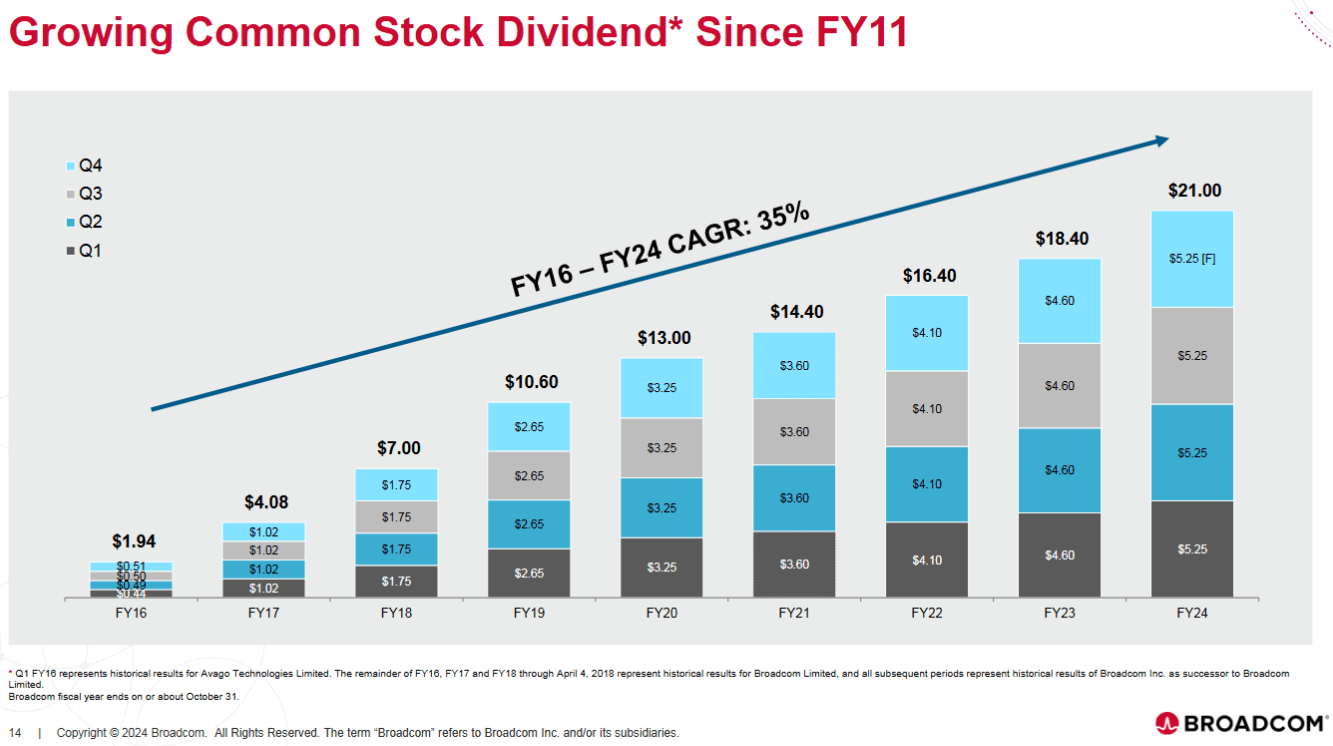
(If you know of a better dividend growth stock in the S&P500 over that period of time, please let me know).
Secondly, “value” in the broad sense of the word means a company has significantly undervalued assets and/or is “on sale” versus the broad S&P500. That could certainly be the case with Broadcom after its acquisition of VMWare. After all, Broadcom CEO Hock Tan has a proven and successful track record when it comes to ringing-out efficiency and excellent free-cash-flow from big acquisitions: AT&T’s Bell Labs, LSI Logic, CA Technologies, and Symantec for example. In the case of the latest deal – VMWare – Broadcom significantly expanded its high-margin Enterprise Software Segment, and it will be the major driver of growth this year. As Hock said on the Q2 conference call:
In our fiscal Q2 2024 results — consolidated net revenue was $12.5 billion, up 43% year-on-year as revenue included a full quarter of contribution from VMware. But if we exclude VMware, consolidated revenue was up 12% year-on-year
and
In Q2 infrastructure software segment revenue of $5.3 billion was up 175% year-on-year and included $2.7 billion in revenue contribution from VMware, up from $2.1 billion in the prior quarter. The integration of VMware is going very well. Since we acquired VMware, we have modernized the product SKUs from over 8,000 disparate SKUs to four core product offerings and simplified the go-to-market flow, eliminating a huge amount of channel conflicts.
We are making good progress in transitioning all VMware products to a subscription licensing model. And since closing the deal, we have actually signed up close to 3,000 of our largest 10,000 customers to enable them to build a self-service virtual private cloud on-prem.
In its Q2 results announced in June, Broadcom generated $4.45 billion of free-cash-flow, or 36% of revenue. Some companies would dream to having that kind of FCF margin, but on a historical basis, it is actually quite low for Broadcom. For example, in FY2023 (prior to the VMWare close), Broadcom had a free-cash-flow margin of 51%. So this is the value thesis behind Broadcom: excellent dividend growth and a continuation of Hock Tan ringing out efficiencies – and growing – the high-margin VMWare business and its free-cash-flow contribution to the company. Meantime, Broadcom continues to be a significant beneficiary of the AI data-center build-out through its leading global position in high-speed networking products and its custom semiconductor compute engine designs for the hyperscalers (like Google (GOOG)). For more technical information on Broadcom’s position, investors should consider reviewing Broadcom’s “Enabling AI Infrastructure” presentation.
The #3 holding in MGV with a 3.2% weight is Berkshire Hathaway (BRK.B). Berkshire is widely known as a diversified conglomerate with interests in railroads, utilities, and insurance as well as keeping a large portfolio of individual company stocks. As of the most recent report, and despite selling a large chunk of Apple (AAPL), it continues to be the biggest position, by far, in the Berkshire equity portfolio:
Kiplinger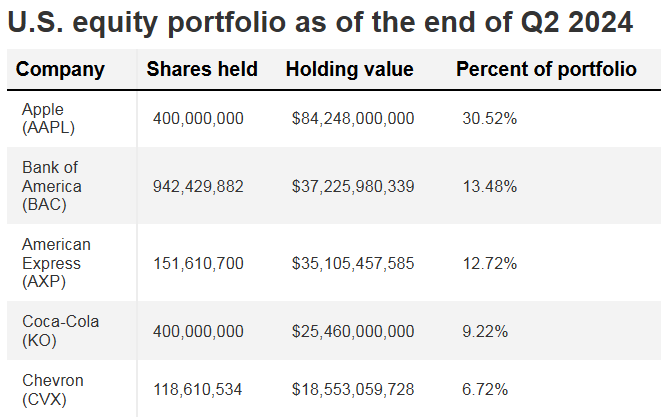
But, of course, it isn’t just Berkshire’s businesses and equity portfolio that make it a “value stock”. I say that because the company ended Q2 with a whopping $277 billion in cash. By the way, Berkshire’s operating earnings in Q2 were $11.6 billion (+15.5% yoy).
Exxon Mobil (XOM) is the #4 holding with a 3.1% weight. Exxon currently yields 3.2% and the company has excellent upside potential with its prolific Guyana leasehold and now that Engine #1 was able to win three seats on Exxon’s board and convince the company to stop – or at least slow down – the massive cap-ex over-spend on huge global pet-chem projects. Engine #1 has influenced Exxon’s management to instead focus on improving the company efficiencies (something Exxon should have been doing all along …).
Healthcare & pharma are well-represented in the top-10 holdings with leading companies like UnitedHealth Group (UNH), Johnson & Johnson (JNJ), and AbbVie (ABBV) equating to a combined 7.3% of the entire portfolio.
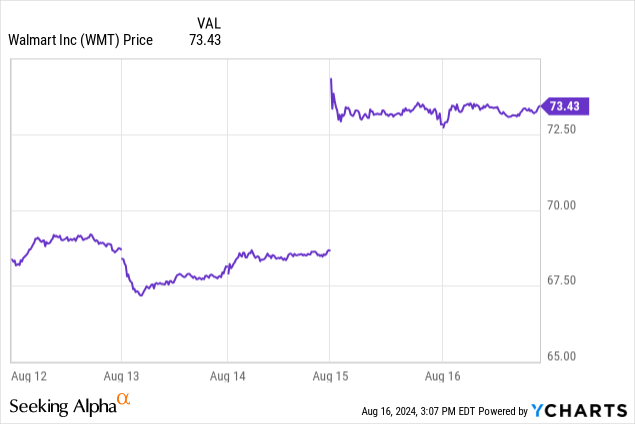
Rounding out the top-10 holdings is Walmart (WMT) with a 1.8% weight. The big retailer delivered a strong beat-and-raise with its Q3 earnings report yesterday (Thursday) as its Global eCommerce sales grew 21%, led by store fulfilled pickup & delivery and marketplace. The stock popped significantly after the upbeat report:
From an overall portfolio perspective, the MGV ETF is most highly exposed to the Financial Sector (21.2%), a sector that in theory should generally be a beneficiary of an expected cut in the Federal Reserve’s interest rates next month because banks can borrow at lower short-term rates and lend at higher long-term rates:
Vanguard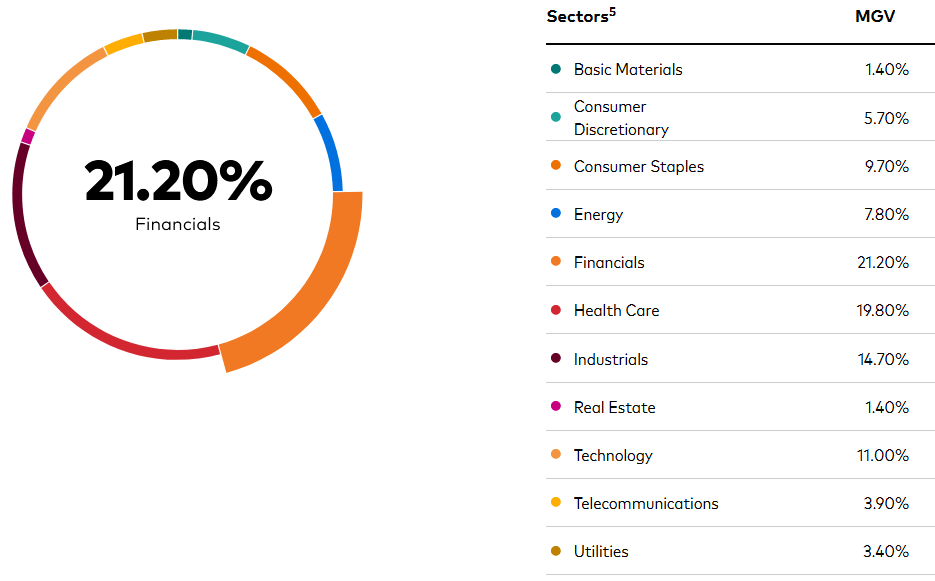
To demonstrate the difference in MGV’s portfolio construction versus the S&P500, note that its sister fund VOO has 31.4% allocated to the IT sector, whereas MGV has ~20% less in the Tech Sector (i.e., 11%).
Performance
In my opinion, for a value fund, the MGV ETF has a relatively strong performance track record with a 10-year average annual total return of 10.8%:
Vanguard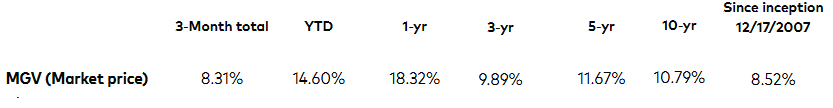
The chart below compares MGV’s 5-year total returns with some other funds in the “value” category, including the Vanguard S&P 500 Value Index Fund ETF Shares (VOOV), the Vanguard Value Index Fund ETF Shares (VTV), the iShares S&P 500 Value ETF (IVE), and the SPDR Portfolio S&P 500 Value ETF (SPYV):

As you can see from the graphic, the MGV ETF is near the bottom of the list and was outperformed by the winner – the SPDR SPYV ETF – by ~7.5% over the 5-year period shown. Part of that is because SPYV’s expense fee (0.04%) is 3 basis points lower than MGV’s (0.07%).
Valuation
The chart below, compliments of Vanguard’s “Funds Comparison” tool, compares the valuation metrics of MGV versus the S&P500 (i.e. the VOO ETF):
Vanguard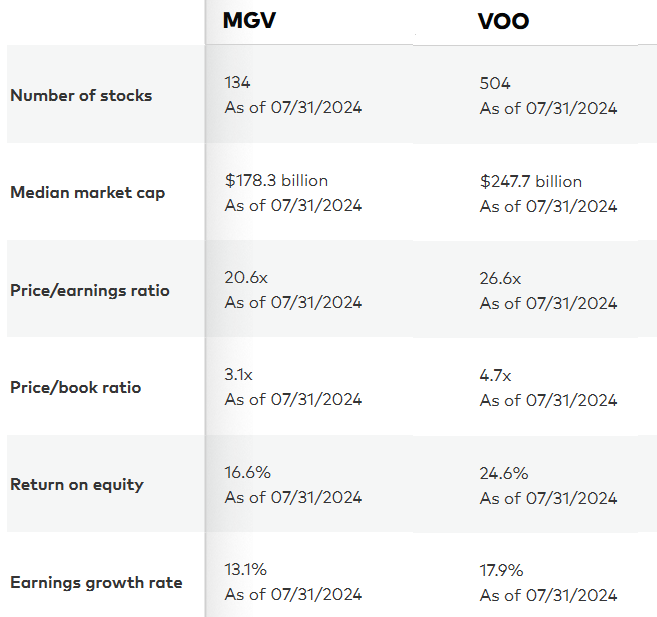
As you can see in the graphic, MGV’s P/E and Price-to-Book ratios are significantly below that of the S&P500: 22.6% and 34.0% lower, respectively. The flip-side of the coin in terms of tradeoffs is that the MGV ETF also has significantly lower ROE and Earnings Growth Rates: 32.1% and 26.8% lower, respectively.
Risks
The risk of investing in the MGV ETF includes the fact that it too is exposed to the global macroeconomic environment, just like most any other equity-based fund is. That said, the thought process with a “value” oriented fund is that if there was a significant market sell-off in the broad market, a value-oriented ETF like MGV would decline less than the S&P500.
Also, there are opportunity costs associated with owning a value ETF like MGV. The chart below compares the 5-year total returns of the MGV ETF versus the broad market averages as represented by the DJIA ETF (DIA), Invesco QQQ Trust ETF (QQQ), and the S&P500 as represented by the VOO ETF:
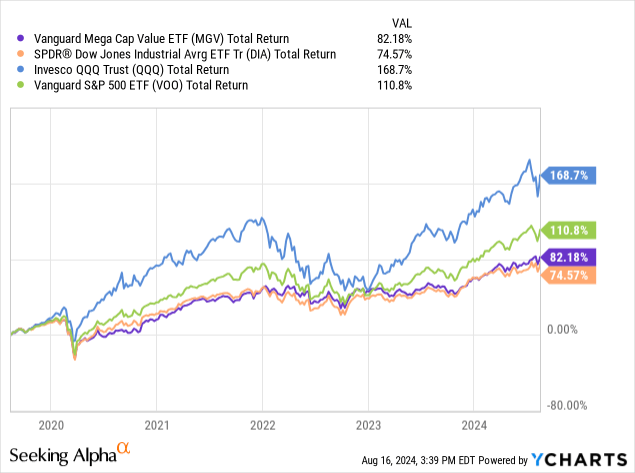
As you can see from the chart, the MGV ETF did beat the returns of the DJIA over the past 5-years, but significantly lagged the returns of the S&P500 and the Nasdaq-100. In my opinion, this is why most portfolios should have a much bigger allocation to the VOO ETF as compared to a “value” oriented fund. Indeed, when began my Seeking Alpha coverage of the MGV ETF back in July of 2022 with a BUY recommendation, the fund has returned 23.8% while the S&P500 has returned 35.1% (see MVG: Vanguard’s Mega-Cap Value ETF Is A Winner).
Summary & Conclusion
The MGV ETF is a solid value-oriented ETF with a strong 10-year average annual total return of 10.8%. However, the SPDR S&P500 Value SPYV ETF has a lower expense fee and has delivered better performance. The VTV ETF has the same expense fee as MGV, but has under-performed it while the VOOV ETF has a higher expense fee (0.10%) and outperformed MGV by 6%+ over the past 5-years. I won’t go into the long and boring story of how I ended up with three value ETFs in my portfolio (MGV, VOOV, and VTV), but suffice it to say that I would have already sold MGV (and VTV) and moved the proceeds into my existing and better performing VOOV position but for the fact that I hold those value funds in a regular account and don’t feel like paying the taxes on a sale (at least not yet). Also, to put things into perspective, I should point out that the allocation to the S&P500 in my personal portfolio is ~9x the combined value of all three of the value funds I just mentioned.
Given that there are clearly better performing value funds available, the best I can rate MGV here is a HOLD, and that is based on its relatively strong long-term performance track record and its top-10 Holdings, which I do find attractive.