

stocknshares
Since my latest review in January, PGF is close to flat in price and gained 4% in total return, not much better than a bond benchmark (BND +3.8%) and significantly behind a stock benchmark (SPY +11.2%). This article renews my “Sell” rating due to continued underperformance and unattractive updated data.
PGF strategy
Invesco Financial Preferred ETF (NYSEARCA:PGF) started investing operations on 12/01/2006 and tracks the ICE Exchange-Listed Fixed Rate Financial Preferred Securities Index. It has 93 holdings, a distribution yield of 6.23% and a total expense ratio of 0.56%. Distributions are paid monthly.
Preferred stocks have priority over common stocks in the payment of dividends and proceeds of liquidation, but are generally junior to debt and do not carry voting rights. They are considered hybrid assets and their price behavior is between stocks and bonds.
As described in the prospectus by Invesco, the fund invests in fixed rate U.S. dollar denominated preferred stocks without maturity date (perpetual) issued in the U.S. domestic market by financial companies. Eligible securities must be rated at least B3 by Moody’s or B- by S&P, pay distributions as “qualified dividend income” and meet some requirements such as minimum outstanding amount and liquidity. The index is capital-weighted and rebalanced on a monthly basis. The portfolio turnover rate in the most recent fiscal year was 15%.
PGF portfolio
About 65% of assets has an investment grade rating, although at the lower end (BBB).
Credit risk profile based on S&P rating (Chart: author, data: Invesco)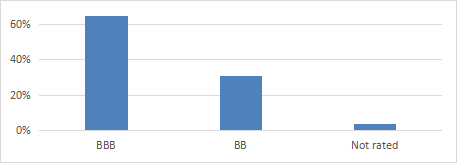
The next table lists the top 10 issuers, representing 61% of asset value. Each of them has several securities in PGF portfolio.
|
Issuer |
Common stock |
Weight % |
|
JPMorgan Chase & Co. |
11.28 |
|
|
Bank of America Corp. |
10.04 |
|
|
Morgan Stanley |
7.92 |
|
|
Wells Fargo & Co. |
6.55 |
|
|
Capital One Financial Corp. |
4.64 |
|
|
Athene Holding Ltd. |
4.54 |
|
|
Allstate Corp. |
4.28 |
|
|
U.S. Bancorp |
4.05 |
|
|
KeyCorp |
3.99 |
|
|
MetLife, Inc. |
3.68 |
Four major banks represent 40.1% of asset value, each of them weighting between 6.5% and 11.3%: JPMorgan Chase, Bank of America, Morgan Stanley and Wells Fargo.
Performance
Since inception, PGF has lagged a 50/50 stock and bond benchmark by 3.5% in annualized return (including distributions). Moreover, it shows a much higher risk measured in volatility and maximum drawdown.
|
Total Return |
Annual.Return |
Drawdown |
Sharpe ratio |
Volatility |
|
|
PGF |
80.63% |
3.40% |
-75.69% |
0.2 |
18.91% |
|
50% SPY + 50% BND |
225.05% |
6.90% |
-28.65% |
0.68 |
8.66% |
The share price has lost about 40% since inception, as plotted on the next chart. In the same time, the cumulative inflation was over 50%, based on the Consumer Price Index. It represents a very large loss in inflation-adjusted value for shareholders.
PGF share price return (Seeking Alpha)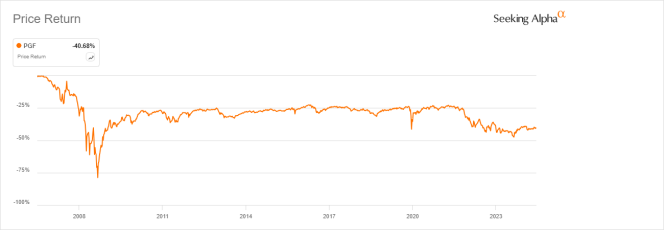
Distribution history is also underwhelming. The annual sum of distributions went down from $1.12 per share in 2013 to $0.90 in 2023. For shareholders, this is a decrease in income stream of 19.6% in 10 years, while the cumulative inflation was over 30% in the same time.
PGF distribution history (Seeking Alpha)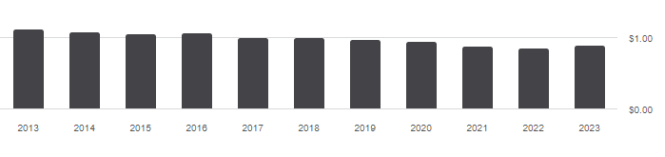
PGF vs competitors
The next table compares characteristics of PGF and three popular preferred stocks ETFs:
- VanEck Preferred Securities ex Financials ETF (PFXF)
- iShares Preferred and Income Securities ETF (PFF)
- Invesco Preferred ETF (PGX)
|
PGF |
PFXF |
PFF |
PGX |
|
|
Inception |
12/1/2006 |
7/16/2012 |
3/26/2007 |
1/31/2008 |
|
Expense Ratio |
0.56% |
0.41% |
0.46% |
0.50% |
|
AUM |
$913.40M |
$1.73B |
$14.42B |
$4.33B |
|
Avg Daily Volume |
$2.23M |
$8.56M |
$109.02M |
$35.68M |
|
Yield TTM |
6.27% |
7.43% |
6.35% |
6.00% |
|
Div. Growth 5 Yr CAGR |
-1.32% |
4.08% |
-0.75% |
-2.76% |
PGF has the highest fee in this list. The next chart plots total returns, starting on 7/17/2012 to match all inception dates. PGF has lagged the ex-financials ETF by 12.6% and is close to the two funds covering all sectors.
PGF vs. Competitors, total return since 7/17/2012 (Seeking Alpha)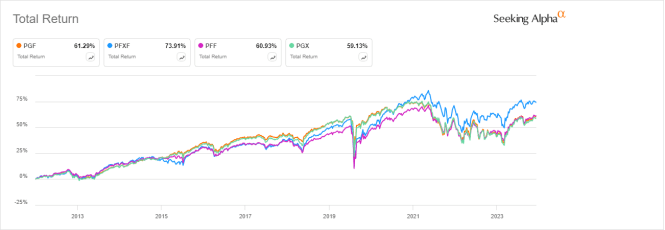
These funds have lost between 14% and 20% in value in 12 years. In fact, none of them looks really compelling.
PGF vs. Competitors, price return since 7/17/2012 (Seeking Alpha)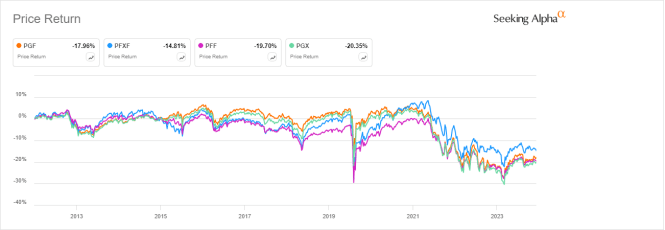
PGF is leading the pack by a very short margin over the last 12 months:
PGF vs. Competitors, 12-month total return (Seeking Alpha)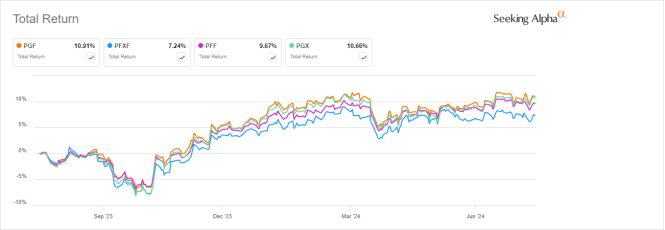
Takeaway
PGF reports a 2-digit decrease in both price and distributions over the last 10 years, while inflation was over 30%. PGF concentration in banks seems to be an additional factor of risk, as it has underperformed a competitor excluding financials. PGF may be an interesting trading instrument to capture market anomalies, but it looks unattractive as a long-term investment.
Editor’s Note: This article discusses one or more securities that do not trade on a major U.S. exchange. Please be aware of the risks associated with these stocks.