

By Brijesh Bhatia
The start of the week witnessed a significant gap-down opening, igniting fear among traders and investors. But the day ended on a positive note. Market sentiment has been cautious, but there are signs that opportunities may emerge in the banking sector.
While Nifty has already surpassed its previous swing low of 22,784, Bank Nifty, which hit a low of 47,884 a few weeks ago, still holds its ground. This divergence could present an opportunity for bullish traders to focus on the banking stocks, as the sector appears poised for potential upside.
What’s particularly exciting is that Bank Nifty has been hovering in a crucial demand zone. This, coupled with bullish reversal patterns forming on the charts of two significant banking stocks—Axis Bank and ICICI Bank—suggests that a shift in market dynamics may be on the horizon.
Before jumping on to the individual stocks, it is important to analyse the overall market condition.

For the past six weeks, Bank Nifty has been hovering around the 62-Week Exponential Moving Average (62WEMA) channel, which serves as a significant support level. This consistent price action at this level indicates a potential buying opportunity as the index remains anchored within the demand zone.
Another key observation on the Bank Nifty chart is the formation of a Bullish Belt Hold candlestick pattern at the lower band of the channel. This candlestick formation is considered a strong reversal signal, indicating that sellers may be losing control and that buyers could step in to push the index higher. Combining this pattern with the support provided by the 62WEMA channel increases the likelihood of a bullish trend reversal in the near term.
Given these technical indicators, Bank Nifty may be on the cusp of a potential rally, and two banking stocks—Axis Bank and ICICI Bank—are showing signs of leading the charge.
In January, mutual funds increased their stake in the bank by an impressive Rs. 9,316 crores, signalling strong institutional confidence in the stock. This is an important fundamental factor, as large-scale investments from mutual funds can be a precursor to higher stock prices.

The stock has found support on a weekly chart at the 200-Week Exponential Moving Average (200WEMA) channel. The 200WEMA is often viewed as a long-term trend indicator, and the fact that the stock is holding above this level suggests it could be in a strong position to rise.
The formation of a bullish harmonic pattern on the chart further strengthens the bullish outlook. Harmonic patterns are often seen as powerful reversal signals. In this case, the pattern indicates that the stock has reached a high potential for a price reversal. This is confirmed by the Bullish Engulfing Candlestick Pattern, a classic sign of bullish reversal, appearing at the same support level. Adding the layer of confidence, these bullish structures are formed between the 50%-61.80% Fibonacci retracement zone.
These combined technical indicators suggest that Axis Bank could see a potential rally if the overall market conditions remain favourable.
ICICI Bank has been one of the top performers in recent weeks, especially when compared to Nifty50 and Bank Nifty.
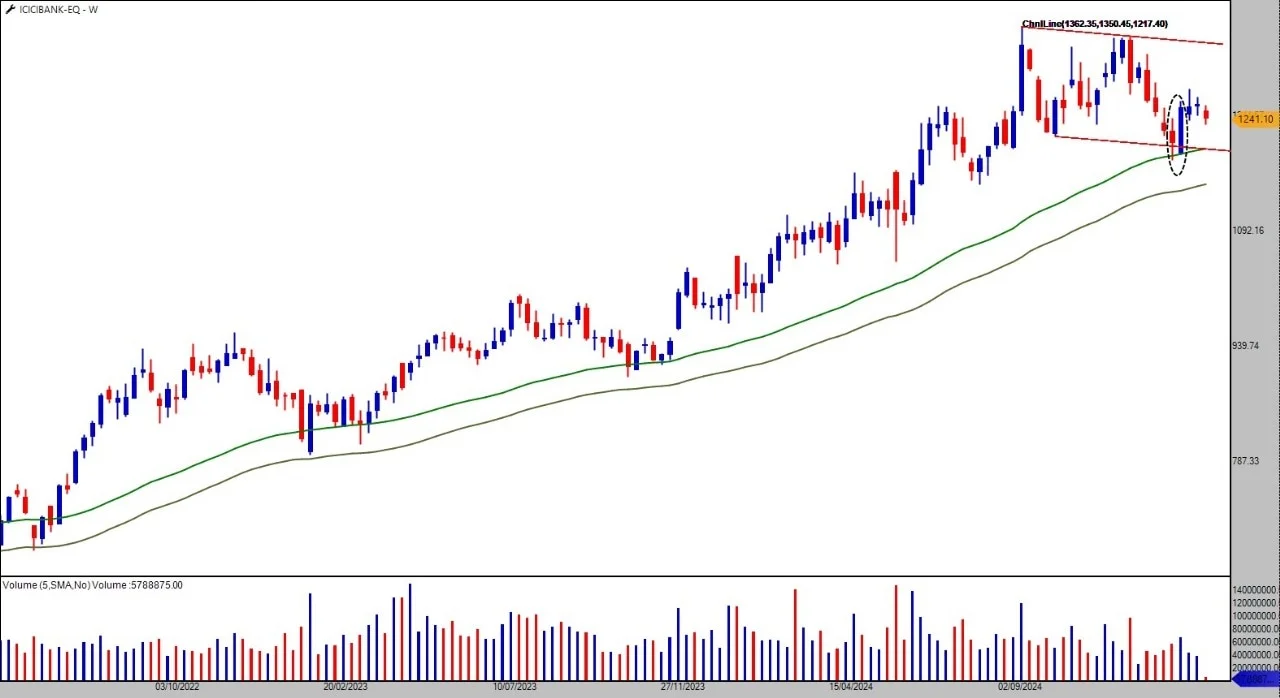
ICICI Bank has recently found support at two important technical levels: the falling channel pattern and the 62WEMA channel. Finding support at both key levels increases the probability that the stock will break higher in the coming weeks.
Additionally, the Bullish Engulfing Candlestick Pattern signals reversal. Significantly higher trading volumes accompany the reversal candlestick than during the retracement phase. This volume increase indicates that buyers are actively stepping in and that the stock could continue its upward movement in the near term.
The strong volume also suggests that there is genuine demand for ICICI Bank shares, which could potentially push the stock price higher in the short to medium term.
The bulls could be in control
The overall outlook for Bank Nifty and key banking stocks such as Axis Bank and ICICI Bank is becoming increasingly bullish. Despite a gap-down opening to the week, the technical indicators for both the banking index and the individual stocks suggest that bulls may be preparing to seize the opportunity. For traders, this could be a potential opportunity to focus on the banking sector, with Axis Bank and ICICI Bank at the forefront of the potential rally.
Disclaimer:
Note: We have relied on data from http://www.definedgesecurities.com throughout this article. Only in cases where the data was unavailable have we used an alternate but widely used and accepted source of information.
The purpose of this article is only to share interesting charts, data points and thought-provoking opinions. It is NOT a recommendation. If you wish to consider an investment, you are strongly advised to consult your advisor. This article is strictly for educative purposes only.
Brijesh Bhatia has over 18 years of experience in India’s financial markets as a trader and technical analyst. He has worked with the likes of UTI, Asit C Mehta, and Edelweiss Securities. Presently he is an analyst at Definedge.
Disclosure: The writer and his dependents do not hold the Stocks discussed in this article. However, clients of Definedge may or may not own these securities.
The website managers, its employee(s), and contributors/writers/authors of articles have or may have an outstanding buy or sell position or holding in the securities, options on securities or other related investments of issuers and/or companies discussed therein. The articles’ content and data interpretation are solely the personal views of the contributors/ writers/authors. Investors must make their own investment decisions based on their specific objectives, resources and only after consulting such independent advisors as may be necessary.